Releasing any new product these days is a competitive business. Mountains of new products appear daily, complete with well produced intro videos with every new competitor bearing a striking resemblance to one other. But how many of the products of the past stood out from the crowd and continue to remain online today?
In this article I'll be showing how to query the Product Hunt API to collect data. We collected information from all the featured products from Product Hunts 8-year history to determine how many of them still exist online or have disappeared into the tech wilderness. Along the way we'll also discover other interesting insights into the dataset.

Introduction
The source of all the data I talk about here is from the Product Hunt API. I've queried it to return details of all their featured products over its history from December 2013 to the end of January 2022, which totals over 90,000 products.
Product Hunt has two versions of their API currently available, one a standard REST based interface (deprecated) and v2 being based on GraphQL. I've used their older API as it returns much more data per query (50 posts with all data vs 20 posts with limited data) enabling us to get the full dataset to work with in just a few hours.
Collecting the Data
Getting all the data necessary for this analysis was a 3 stage process. We illustrate this with a simplified query of a single product below. I'm using Python and HTTPX to make my queries, but you can use any language and library you're familiar with.
First, we query the Product Hunt API to return pages of product details as JSON, ensuring to return as large a dataset as possible with the "per_page" param. In order to query any data, you also need to set an AUTH Bearer token. Our first query to the API is therefore as follows:
import httpx
import os

PRODUCTHUNT_DEV_TOKEN = os.environ.get("PRODUCTHUNT_DEV_TOKEN")

headers = {"Authorization": f"Bearer {PRODUCTHUNT_DEV_TOKEN}"}

with httpx.Client(headers=headers) as client:
    r = client.get(
        "https://api.producthunt.com/v1/posts/all",
        params={"per_page": 50},
        timeout=20,
    )
    redirect_urls = [p['redirect_url'] for p in r.json()]
NB. In our actual code, we would need to consider the 'x-rate-limit-remaining' and 'x-rate-limit-reset' header values returned from the API response while making multiple subsequent queries. This tells us how many responses we have remaining and when the rate will reset again. To allow for this, when we reach the limit, we add a delay which matches when our request resets.
Product Hunt only exposes redirect urls for each product so as a second step it's also necessary to make a HEAD request to each of these to find each products original url.
try:
    r2 = client.head(redirect_url, timeout=20)
    if r2.status_code == 301:
        original_url = r2.headers["Location"]
        print(f"{redirect_url} -> {original_url}")
except Exception as e:
    print(f"{redirect_url} - {e}")
Finally, equipped with the actual product url, we can make a HEAD request to determine each products current status and collect other useful header data.
try:
    r3 = client.head(original_url, timeout=20)
    print(f"Status Code: {r3.status_code}")
    for k, v in r3.headers.items():
        print(f"{k} - {v}")
except Exception as e:
    print(f"{original_url} - {e}")
In total therefore it's necessary to make 2 additional queries for each of the over 90k products available in the API. That could take a long time - but an added benefit of using HTTPX over something like Requests for this is that each of our HEAD requests above can be returned asynchronously and speed up the entire process of making over 180k HEAD requests(!) required to enrich the Product Hunt API data in this way.
Results
Next, we look at the data retrieved against a variety of attributes we gathered. Firstly, lets consider the entire set of products as a whole.
Number of Products
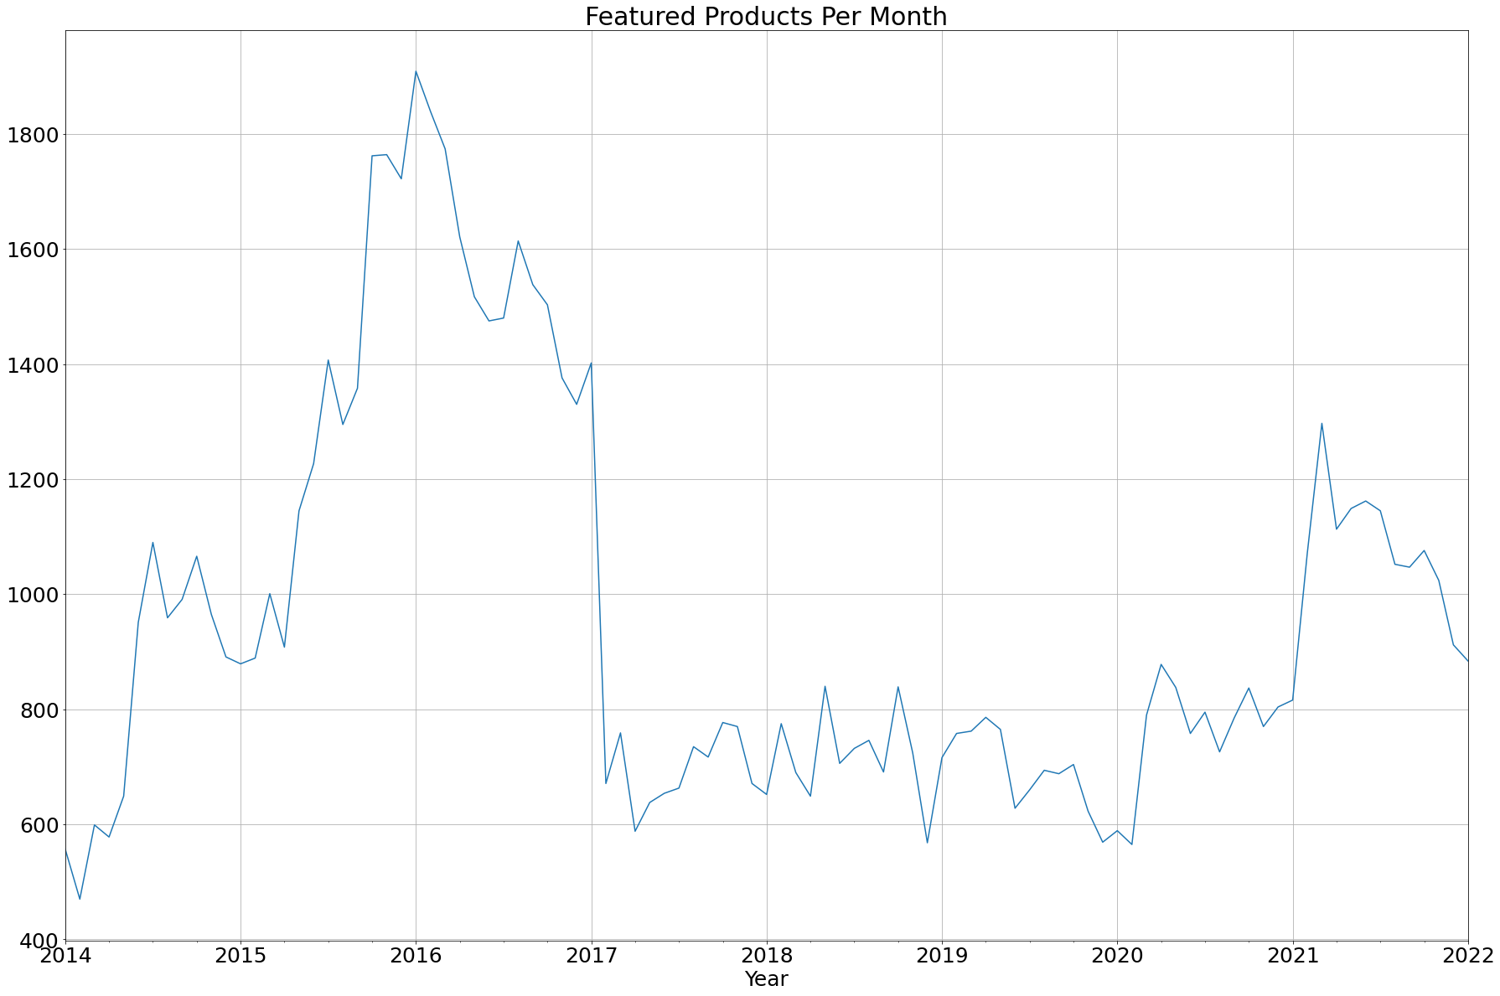
We can see how the total products break down to monthly featured products over the entire 8 year period we have data for. Through to 2016, the number of products steadily increases before dramatically reducing in 2017. My thinking here is that other places to showcase products may have started cropping up around this time. It's only more recently in the pandemic era from 2020-2021 that we see a marked increase in the regular number of products featured each month again.
edit: "The drop is largely because we deprecated podcasts, games, and book categories. We used to have separate sections on the site for these types of products, which dramatically increased the number of "featured" posts because we essentially reduced scope." Ryan Hoover, founder of Product Hunt
Types of Errors
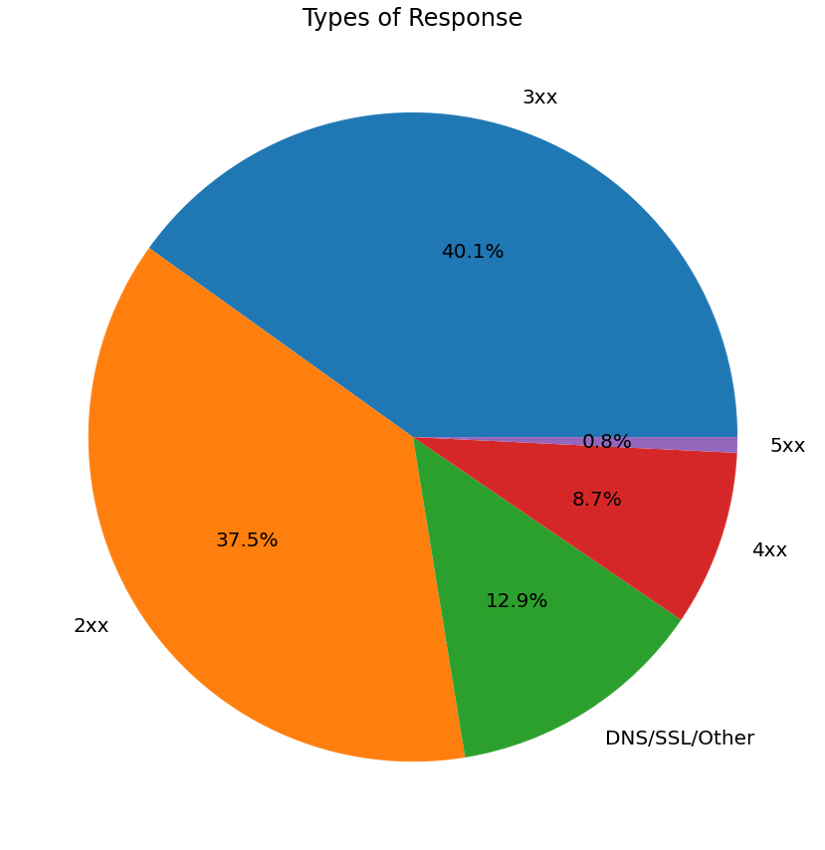
As described, we visited each product url to determine whether it still exists, or it now returns some sort of error. Errors are categorized as one of 3 types based on their HTTP status code, or if another form of exception occurs (e.g. DNS, SSL). We consider a 2XX (Success) and 3XX (Redirection) status codes successful. Over the entire dataset, I found 20,970 (or 22%) of products now produce some form of error. You can see how that breaks down in the chart below, where the split between response types is shown for all products.
Product Votes
Next, we take a look at products according against the votes they received. Ordering by votes we found the top and bottom 5 voted products of all time. The top 5 are:
- http://startupstash.com (in 2015 with 21,839 votes)
- https://slack.com (in 2013 with 17,432 votes)
- https://www.remove.bg (in 2018 with 16,951 votes)
- https://attach.io/startup-pitch-decks (in 2016 with 11,101 votes)
- https://www.pexels.com (in 2015 with 10,247 votes)
I've not listed the bottom 5 to save embarrassment (of course, there is nothing to be embarassed about) for the makers involved, but instead note that all products from both groups all still return successful HTTP responses.
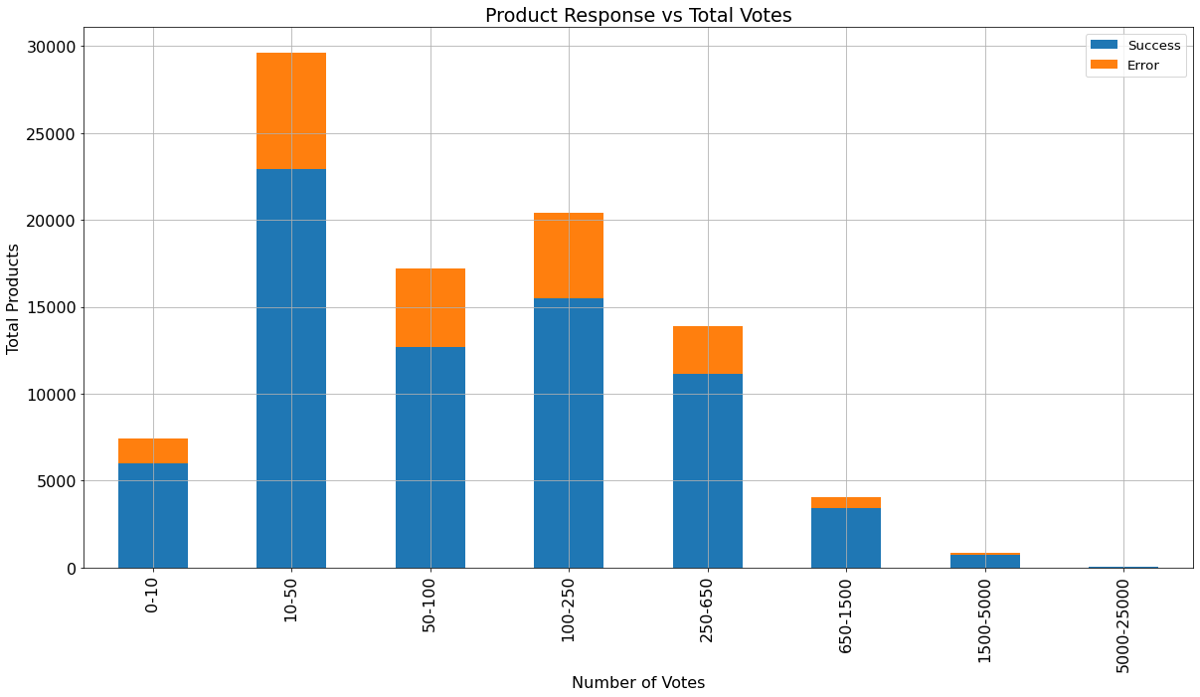
We were interested to learn if there was a correlation between the number of votes a product received and whether it still exists. Grouping the data by vote count allows to clearly see that the vast majority of products receive between 10-50 votes, with the average being 179 votes. The amount of products with over 5000 votes is just 31.
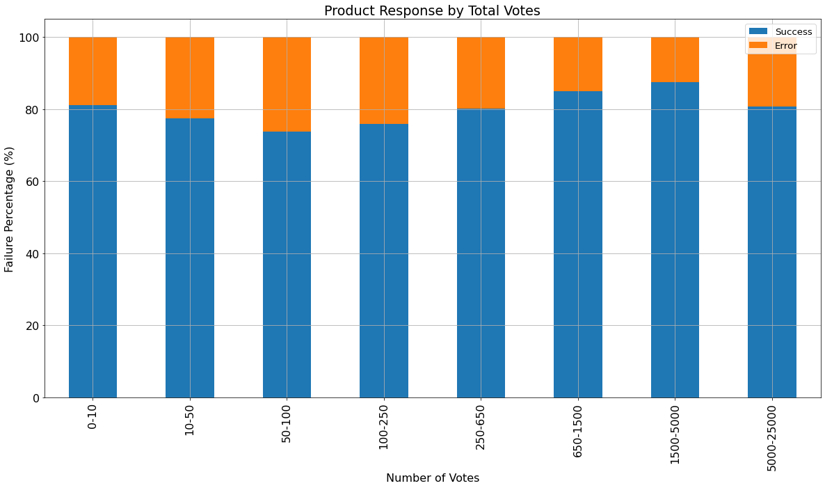
When viewed as a percentage, there isn't any obvious relation that exists with the percentage of failures fluctuating over about 14% over all the groups. Most failures occurred in products with 1500-5000 votes (87%) when viewed this way.
Topics for Failures
We analyzed the products to find if there were any interesting topics they belonged to. Firstly, lets see which topics were most popular with Product Hunt voters. We look at the topics with most votes over the entire dataset.

There's really not many surprises here, with the the somewhat generic "tech" topic being the outright leader to the tune of over 10M votes, more than double of any other topic.
Next, I considered those with the lowest and highest proportion of products which now return errors (of any type). I've filtered out smaller outlier topics (with under 100 total products) and inspect the top 5.
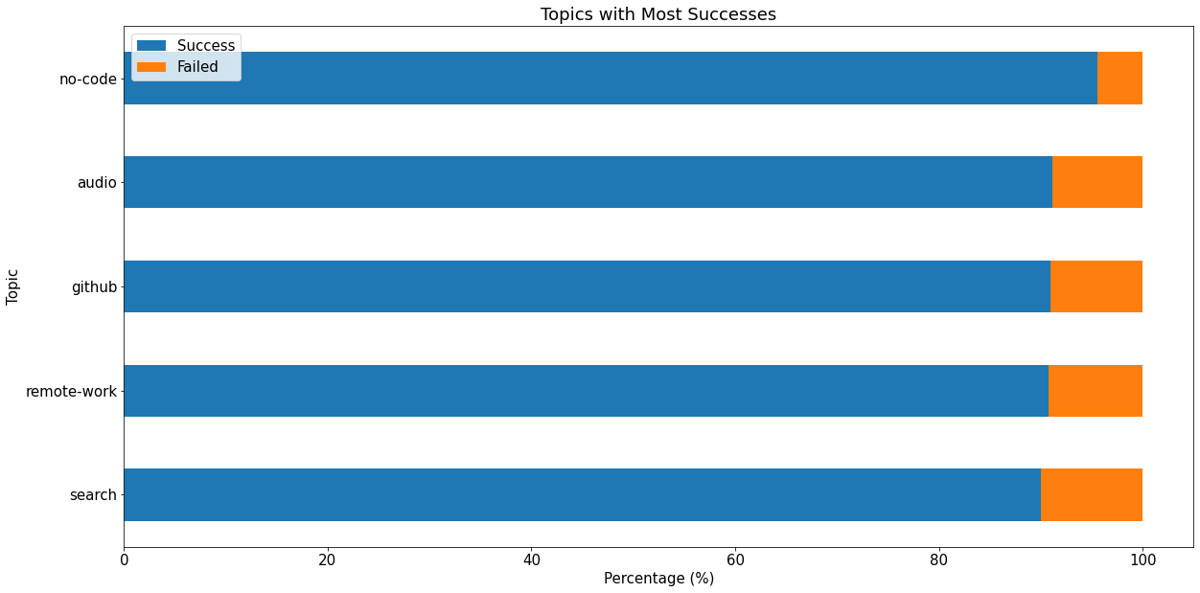
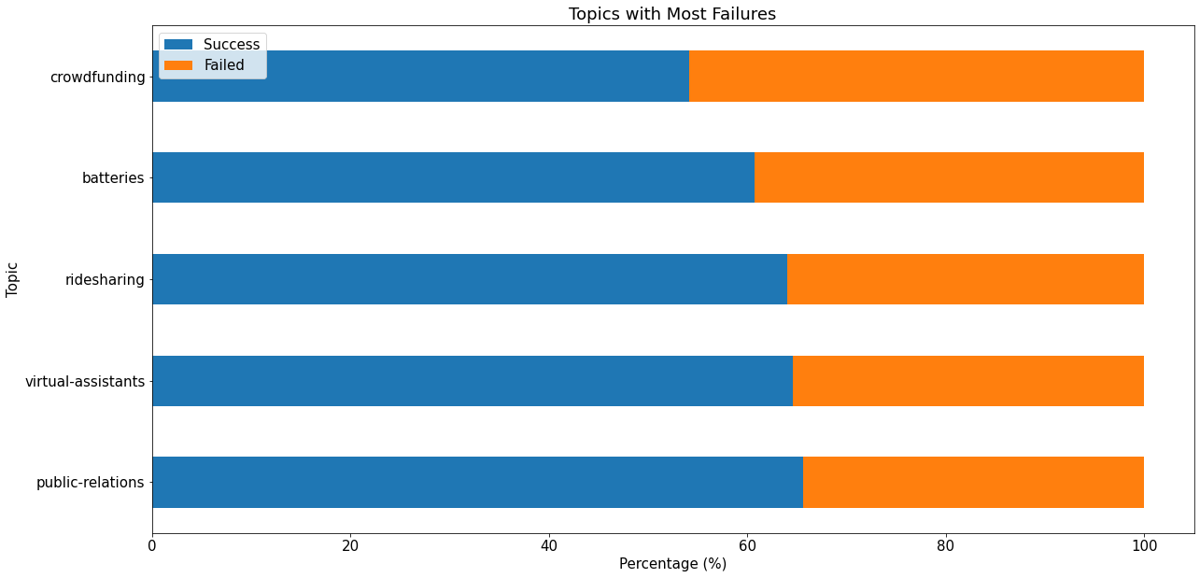
It's interesting to note that "no-code" is the topic with least percentage of errors recorded whilst "crowdfunding" has the highest percentage of failures. Topics fall in and out of favor with posters over time and I would consider this a more recent topic, so wanted to dig into when topics were posted to.
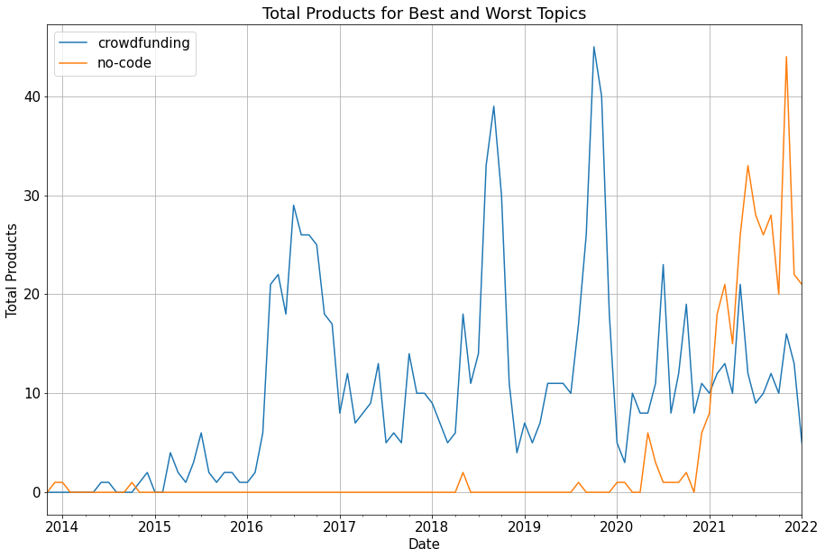
We can confirm this by taking a look at the number of products using these topics over time (shown below). Sure enough, we can see that "no-code" only really crops up in the last couple of years, meaning all products in that category are far more recent. By comparison, "crowdfunding" has been regularly posted to throughout Product Hunts history and would likely return a higher number of products that now return errors.
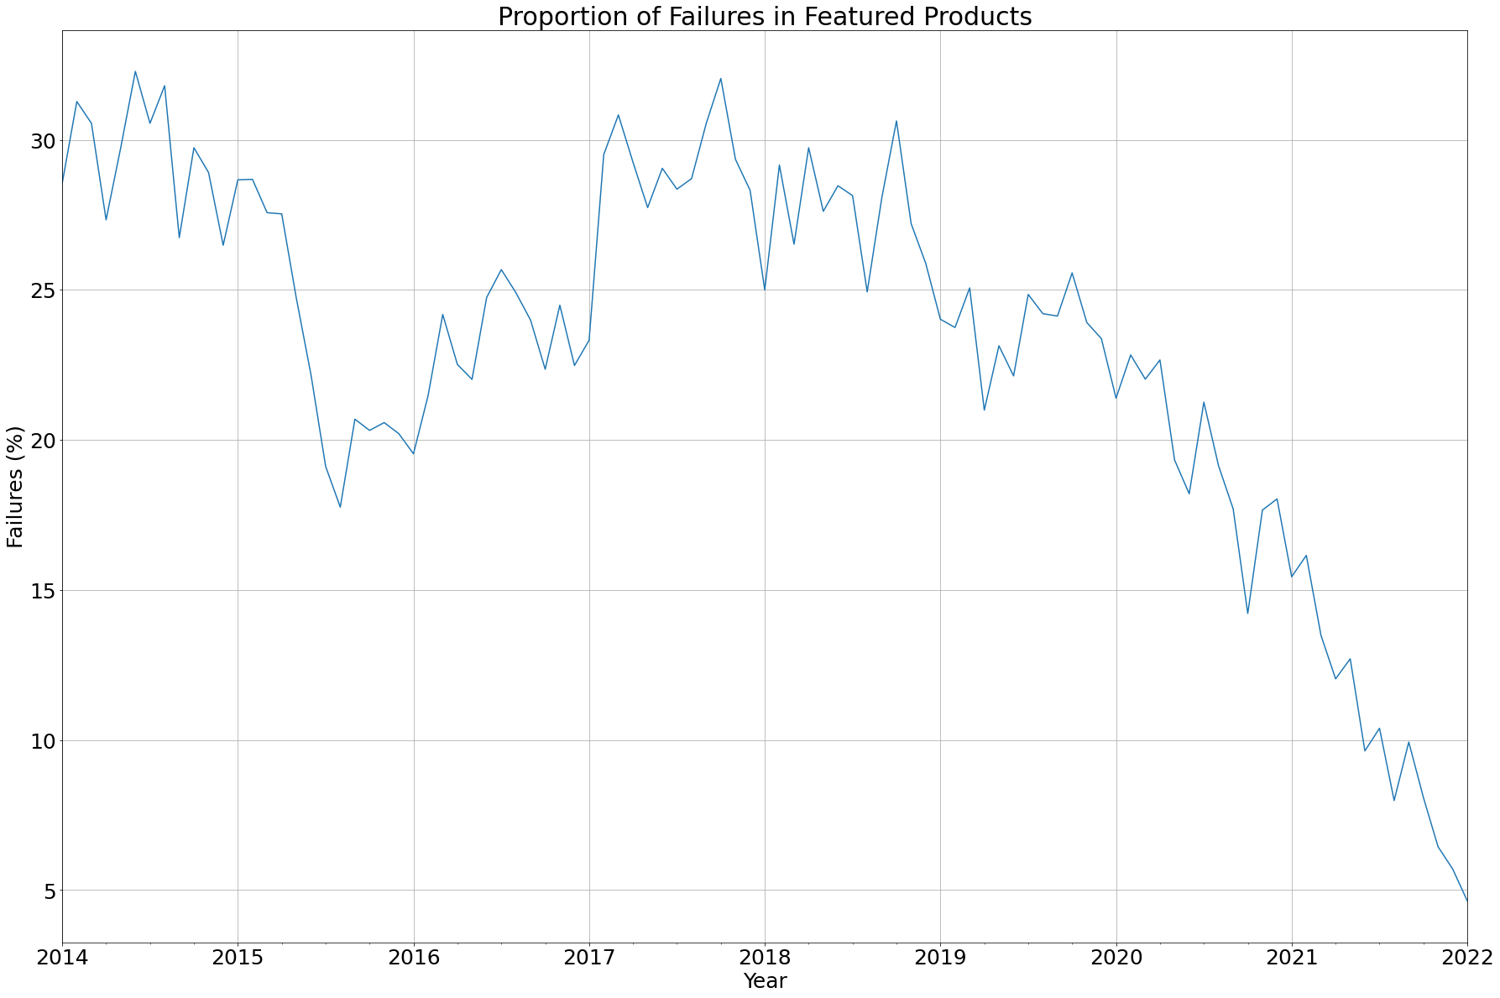
Errors Over Time
Finally, we dig into the data a little more to look at the error types found vs the date when the product was actually featured on Product Hunt.
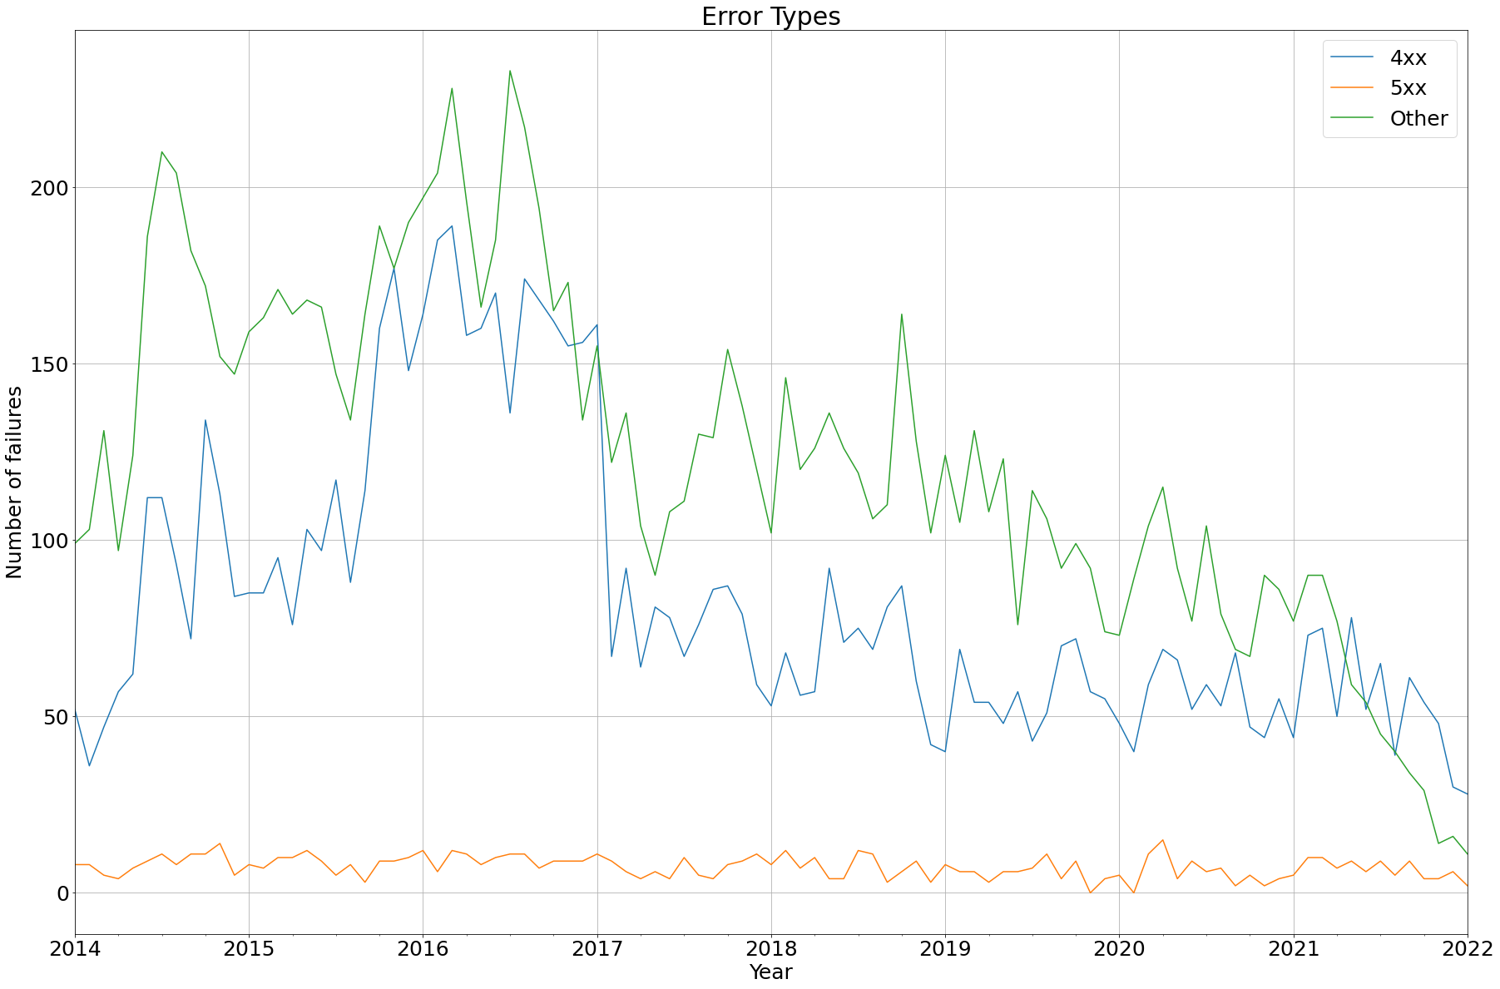
As you might expect, the further back in time we go, the more errors we see with a peak correlating to when the greatest number of products were being posted to Product Hunt (in 2016) that we saw in our earlier chart. We can see 4xx and other types of error bearing a close correlation to one another throughout the data we have.
Interestingly, when looking at the percentage of products producing errors we can see that overall, there's actually proportionally less failures in Product Hunts busiest period, with the highest percentage of failures being 32% for products featured in July of 2014.
Grouping the data by year allows us to see and compare the volume of errors in each period a little more easily. As mentioned, you can see there isn't really a huge change in the volume of errors in very early years, with the proportion of errors overall steadily decreasing through til 2022.

Conclusion
In this post I showed how you can collect data from the Product Hunt API with HTTPX. The API is full of useful information about products over a very long period of time that is available to query for your own projects.
We looked at a number of product attributes, such as popularity and topics they were posted to. Finally, we plotted the entire dataset to show the current status of products over time. We found that whilst many products are still available, 20,970 (or 22%) are no longer reachable for some reason with the strongest correlation being against the products age.
Be sure to run your own data experiments on the Product Hunt API to see what else you can find out!
If you liked this article, you will probably like the one we wrote last year on how to find the best possible HackerNews title.