Playwright on Kubernetes lets you distribute a browser test suite across pods, then combine the results into one report. A pod is the Kubernetes unit that runs the test container. A shard is one portion of the test suite. This tutorial uses Playwright's --shard flag and a connected Testkube agent to build that workflow. It also examines the startup costs, resource settings, and scheduling decisions that can make additional shards slower.
Get the code and benchmark data from the companion GitHub repository.
I built the original setup on a two-node K3s cluster and tested suites containing 144 and 1,440 tests. A follow-up validation on that cluster included five randomized runs per configuration, checked merged reports, and tested failure handling. The smaller suite gained no clear speed advantage from four shards; the larger suite's lowest median occurred at eight shards.
The steps assume you already have a Kubernetes cluster and can run commands against it. The benchmark describes this test suite and cluster; use it as a starting point for measuring your own workload.
What the workflow does
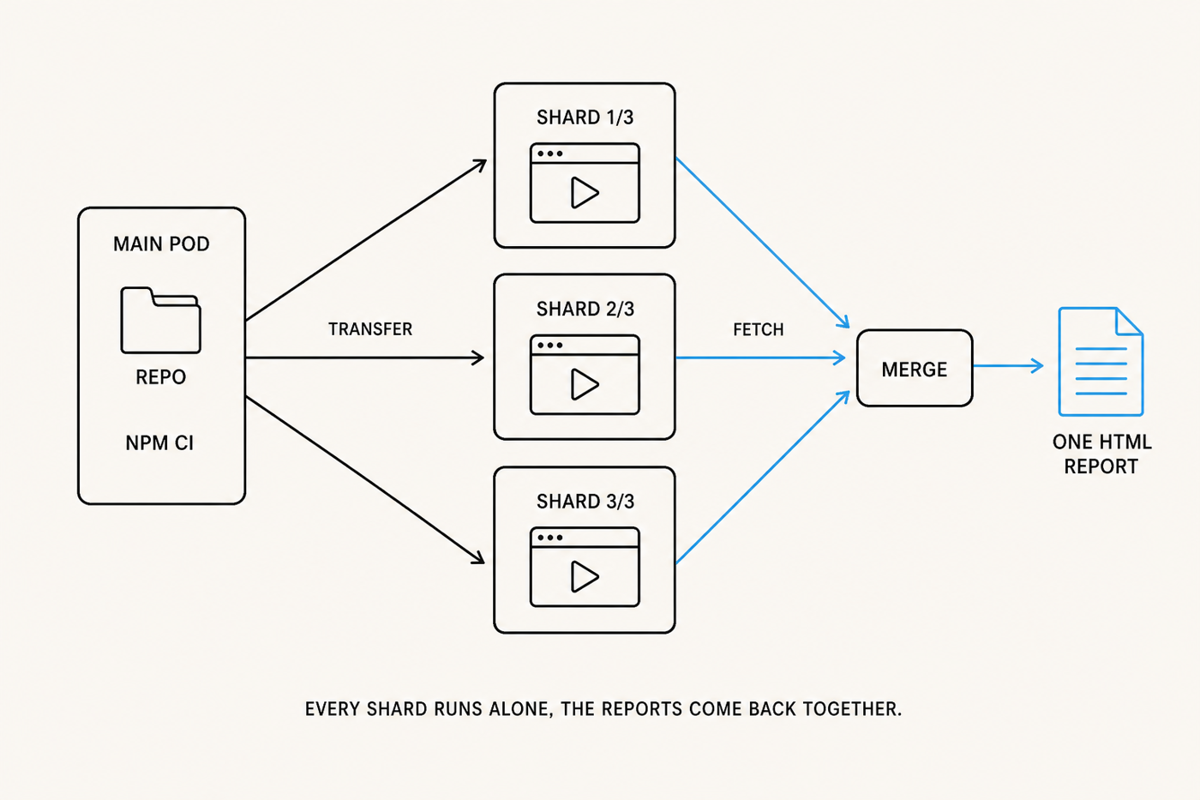
The main execution pod checks out the suite and installs its dependencies. Testkube starts a pod for each shard, subject to a concurrency cap, and transfers the prepared repository to it. Each shard runs Playwright and produces a blob report. Testkube retrieves those reports so the main pod can merge them into a readable HTML report. These operations are supported by Testkube's parallel steps, transfer, and fetch features.
Kubernetes is useful when you already operate a cluster and want test workloads to use capacity across its nodes. A larger continuous integration (CI) runner may be simpler for a smaller workload. Both arrangements require measuring central processing unit (CPU) use, memory, and startup overhead.
A Kubernetes Indexed Job is another option. Its completion index can identify each shard, and its parallelism field caps concurrent pods. Testkube adds workflow steps for setup, file transfer, report collection, and execution tracking.
How Playwright shards differ from workers and contexts
This command runs the third shard of an eight-shard suite:
npx playwright test --shard 3/8
Each shard must discover the same test set using consistent configuration, filters, and source code. Playwright assigns the tests without a central work queue. With fullyParallel: true, it can distribute individual tests; otherwise, the default grouping is by file. Balancing test counts does not guarantee equal durations. See the Playwright sharding guide.
A shard can run several Playwright workers. Workers are separate operating-system processes, and each launches its own browser. A browser context is a separate session-isolation mechanism, normally used to isolate individual tests. Setting workers: 2 limits worker processes; it does not mean the entire run creates only two contexts. The parallelism documentation explains this lifecycle.
Shards do not share process memory or require a shared scheduler inside the test suite. They can still conflict through shared accounts, database records, files, or external rate limits. Make those dependencies independent before distributing the tests.
Measure CPU and memory before choosing pod concurrency
The original sizing notes recorded container-memory peaks but did not preserve the measurement source or sampling interval, so those values are not used in the sizing guidance. For a reproducible comparison, record container working-set memory, units, sampling interval, workload, worker count, and observed peak for each run.
Summing resident set size across browser processes can count shared pages more than once. Use container-level measurements for sizing and preserve the collection method with the results.
Kubernetes uses resource requests when placing pods. A low memory request can permit more workloads to share a node; it does not itself set the container's memory ceiling. A memory limit is enforced reactively and can result in an out-of-memory (OOM) kill. Node memory pressure can also cause eviction. These are distinct failure modes, as described in Kubernetes resource management.
CPU requests matter too. The original workflow requested 250m, or one quarter of a CPU, per shard while allowing two busy browser workers. That was a weak scheduling signal for this workload. The example retains it to make the benchmark configuration explicit, but it should be measured and reconsidered before production use.
Choose concurrency from the remaining CPU and memory capacity on each eligible node, allowing room for the main execution pod and other workloads. Aggregate free memory alone does not establish how many shard pods will fit or perform well.
Prepare the Playwright on Kubernetes environment
The original environment was:
| Component | Recorded configuration |
|---|---|
| Kubernetes | K3s v1.34.5 with Cilium |
| Nodes | Two amd64 nodes, each with 4 CPUs and 16 GB memory |
| Allocatable memory | Approximately 9.9 GiB and 12.9 GiB |
| Testkube | 2.13.1, using a runner connected to Testkube Cloud |
| Playwright | 1.63.0 |
| Browser image | mcr.microsoft.com/playwright:v1.63.0-noble |
| Per-shard settings | Two workers; 250m CPU request; 1536Mi memory request; 2Gi memory limit |
| Concurrent shard pods | At most five |
You need kubectl, the Testkube command-line interface (CLI), and the installation tools required by your agent setup. Install Node.js and npm locally to run the Playwright commands and open downloaded reports. The companion repository contains the sample application, both generated suites, the Playwright configuration, and the workflow. Clone or download the repository, then open a terminal in its root directory. Run the commands below from that directory so paths such as k8s/testworkflow.yaml resolve correctly.
The application serves a local product catalog and renders 20 items with JavaScript after a 150 ms delay. Each generated spec checks the item count, prices, and title. Playwright starts the application inside each shard pod, so test-page requests do not depend on an external website. Repository checkout, package installation, and Testkube communication still need their respective network connections.
The revised workflow pins source commit 5139f19 and the Playwright image by digest. I verified that image on both amd64 nodes. The image corresponds to v1.63.0-noble. Archived execution logs identify Git commit 99aba8b for the six original small-suite benchmark runs and Git commit 58f837e for the eight original large-suite runs. The revised source differs from 58f837e only in .gitignore.
Step 1: Connect the Testkube agent
This workflow requires an agent connected to a Testkube control plane. The control plane can be cloud-hosted or installed on premises. Standalone mode does not support the parallel operation used here. Check the standalone-agent limitations before installing.
I initially tried a standalone installation. The first parallel run failed with this message:
"parallel" operation is not available when running the Testkube Agent in the standalone mode
For Testkube Cloud, create an environment and register an agent through its setup flow. Use the generated installation instructions for that environment and your agent version. For a self-hosted control plane, follow its corresponding setup instructions. Testkube documents both Cloud installation and on-premises installation.
Avoid placing an agent secret directly in helm --set arguments. Shell history and process listings can expose it, and special characters can be misparsed. Use the secret-input mechanism supported by the selected chart, such as a protected values file or an existing Kubernetes Secret where supported. Keep credential files out of Git; a values file also does not remove the need to protect Helm release data.
Configure the Testkube CLI for the same control-plane environment, then check the connection:
testkube status
In the connected setup used here, register workflow definitions through Testkube's application programming interface (API) with testkube create testworkflow. Applying a custom resource locally with kubectl apply alone does not register that definition in this control plane.
Step 2: Configure the suite for sharding
The relevant configuration is in playwright.config.ts:
import { defineConfig } from '@playwright/test';

const workers = Number(process.env.WORKERS || 2);
const testDir = process.env.TEST_DIR || './tests';

export default defineConfig({
  testDir,
  fullyParallel: true,
  workers,
  retries: 0,
  timeout: 30_000,
  reporter: process.env.CI ? [['blob'], ['line']] : [['line']],
  use: {
    baseURL: 'http://127.0.0.1:4173',
    headless: true,
    trace: 'off',
    launchOptions: { args: ['--disable-dev-shm-usage'] },
  },
  webServer: {
    command: 'node app/server.js',
    url: 'http://127.0.0.1:4173/catalog/1',
    reuseExistingServer: true,
    timeout: 30_000,
  },
  projects: [
    { name: 'chromium', use: { browserName: 'chromium' } },
  ],
});
WORKERS selects the worker-process cap, and TEST_DIR switches between tests and tests-large. Supply a positive integer for WORKERS. The example preserves the original configuration, including server reuse; in shared CI environments, consider disabling reuse so an unintended existing server cannot satisfy the readiness check, then validate that change separately.
The Chromium flag retains the original shared-memory workaround. A small /dev/shm is common in container runtimes, but its size is not a Kubernetes guarantee. Check it in the actual test container:
df -h /dev/shm
--disable-dev-shm-usage redirects that usage to /tmp, which can affect storage use and performance. Another Kubernetes option is a memory-backed emptyDir mounted at /dev/shm; account for its memory consumption when sizing the container. Playwright recommends --ipc=host for Docker, but sharing the host interprocess communication (IPC) namespace in Kubernetes also requires an isolation decision. See the Playwright Docker guidance.
Step 3: Define the test workflow
Save this definition as k8s/testworkflow.yaml. Testkube loads the suite from the Git repository and commit named in the manifest, not from your local working directory. If you change the tests or Playwright configuration, push those changes to your repository and update uri and revision to that repository and commit. The definition retains the original resource settings and adds an explicit check for missing blob reports.
apiVersion: testworkflows.testkube.io/v1
kind: TestWorkflow
metadata:
  name: playwright-sharded
  namespace: testkube
spec:
  config:
    shards:
      type: integer
      default: 8
    workers:
      type: integer
      default: 2
    suite:
      type: string
      default: tests
  content:
    git:
      uri: https://github.com/pablodelarco/playwright-k8s-testkube
      revision: 5139f1929b62f201b7ecad199d938e2e1ec8d2c6
  container:
    image: mcr.microsoft.com/playwright@sha256:eff16c30e6f3f4af0a03fa4b706120d5e9b0891c344a27d64559aff5900a4a27
    workingDir: /data/repo
  steps:
    - name: Install dependencies
      shell: npm ci
    - name: Run shards
      parallel:
        count: "config.shards"
        parallelism: 5
        transfer:
          - from: /data/repo
        fetch:
          - from: /data/repo/blob-report
            to: /data/reports
        container:
          env:
            - name: CI
              value: "1"
            - name: WORKERS
              value: "{{ config.workers }}"
            - name: TEST_DIR
              value: "{{ config.suite }}"
          resources:
            requests:
              cpu: 250m
              memory: 1536Mi
            limits:
              memory: 2Gi
        shell: |
          npx playwright test --shard {{ index + 1 }}/{{ count }}
    - name: Merge reports
      condition: always
      shell: |
        set -- /data/reports/*.zip
        if [ ! -f "$1" ]; then
          echo "No blob reports were produced; inspect the shard logs and pod status." >&2
          exit 1
        fi
        npx playwright merge-reports --reporter=html /data/reports
      artifacts:
        paths:
          - playwright-report/**
count determines how many shard instances the execution creates. Testkube's index is zero-based, so index + 1 supplies Playwright's one-based shard number. parallelism: 5 admits at most five shard instances concurrently. Eight or 32 shards therefore do not all run together.
npm ci runs once in the main pod. transfer copies the checked-out source and installed dependencies into each shard pod. Keep package-lock.json and the Playwright image aligned: the image includes browser binaries, but the project still needs its Playwright package. The manifest pins the image digest verified on both nodes for the revised runs.
The memory request is 1536Mi, or 1.5 GiB; the limit is 2Gi. These values reproduce the tested fixture; they are not a sizing recommendation. They do not guarantee sufficient memory for a different suite. There is no CPU limit in the manifest, so a shard can use more than its 250m request when capacity is available.
Step 4: Register and run the workflow
Register the definition and start the smaller suite:
testkube create testworkflow -f k8s/testworkflow.yaml --update
testkube run testworkflow playwright-sharded --config shards=8 --watch
Select the larger suite through configuration:
testkube run testworkflow playwright-sharded \
  --config shards=8 --config suite=tests-large --watch
Keep the execution ID with its logs and artifacts. When investigating pod placement or failures, select resources from that execution rather than every recent pod in the namespace. A shared namespace may contain unrelated tests, and the main execution pod must also be counted.
Step 5: Collect and inspect the merged report
Each shard writes blob ZIP files. Their names include shard identity and may also include a configuration hash; do not depend on one exact filename pattern. Preserve the generated names and collect reports into a fresh directory for each execution. See the blob reporter reference.
The workflow's fetch block retrieves those files, and merge-reports creates the HTML report. condition: always attempts the merge after a shard failure. The guard reports a clear error if no ZIP files exist. If only some shards produced reports, inspect the execution status and expected test count: an HTML report can be incomplete.
Retrieve artifacts using the exact execution ID:
testkube get testworkflowexecution
EXECUTION_ID="replace-with-execution-id"
ARTIFACT_DIR="artifacts-$EXECUTION_ID"
REPORT_DIR="$ARTIFACT_DIR/playwright-report"
testkube download artifacts "$EXECUTION_ID" --download-dir "$ARTIFACT_DIR"
npx playwright show-report "$REPORT_DIR"
Replace the example execution ID with the ID from the list. The download command puts that execution's files in a separate directory, and REPORT_DIR points to its HTML report. Check the Testkube execution status as well as the report's test count.
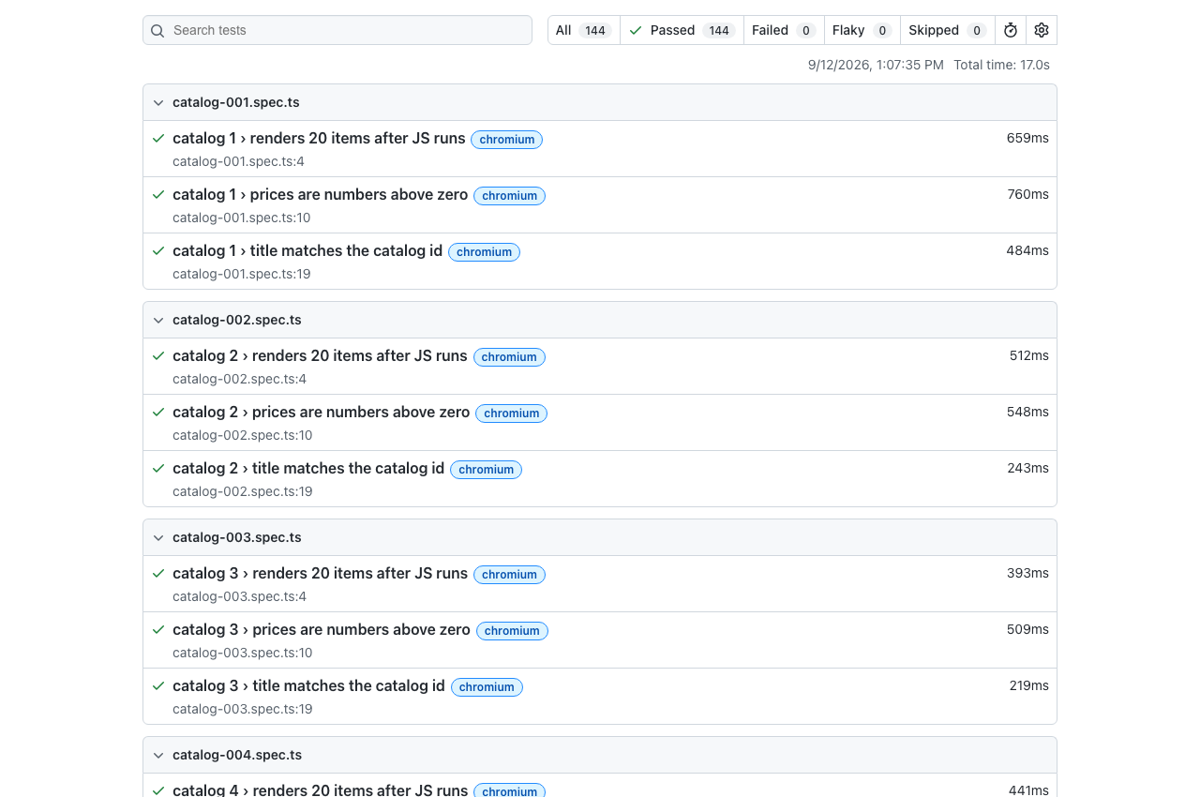
Report downloaded from the September 12 Beelink smoke test. All 144 tests passed. The displayed 17.0 seconds is a Playwright report duration; Testkube recorded 40.287 seconds for the complete workflow.
The revised workflow was also checked with deliberate failures. One extra failing assertion produced a report with 144 passed tests and one failure, while the workflow remained failed. A pre-test failure produced no ZIP files and triggered the guard message. With four workers and a 768Mi memory limit, both shard containers were observed as OOMKilled. These validation cases are excluded from benchmark timings.
Benchmark results from the Beelink cluster
The follow-up benchmark ran on September 12 using the same two-node cluster and the resource settings above. Each suite ran in five blocks, with the order of one, four, eight, and 32 shards randomized within each block. The small suite contains 48 files and 144 tests; the larger suite contains 480 files and 1,440 tests. Each file has three tests against the local fixture. The small suite completed before the large suite; benchmark executions did not overlap.
Both nodes already contained the pinned browser-image layers. This is a warm browser-image comparison: each fresh main execution pod still checked out the repository and ran npm ci. Package caches and network latency were not held constant. Fresh-node end-to-end performance was not measured, and the original image-pull observations remain separate.
CLI wall time runs from the execution launch request through watcher completion. It includes CLI/control-plane latency, setup, scheduling, transfer, tests, and merging. Testkube's own workflow duration is a separate metric. The tables use the CLI metric consistently, with five observations per configuration and 40 complete CLI timings in total. Speedup is the one-shard median divided by the selected configuration's median.
Four shards and one shard had similar medians for 144 tests
| Shards | Total execution pods | Median | Observed range | Speedup |
|---|---|---|---|---|
| 1 | 2 | 59.4 s | 53.7 to 64.7 s | 1.00x |
| 4 | 5 | 59.4 s | 50.8 to 70.0 s | 1.00x |
| 8 | 9 | 63.7 s | 58.0 to 74.8 s | 0.93x |
| 32 | 33 | 146.7 s | 140.1 to 169.6 s | 0.40x |
The unrounded medians were 59.370 seconds for one shard and 59.386 seconds for four. That difference does not support choosing four shards for speed. Four shards finished faster than one in only one of the five paired blocks. Eight shards had a slightly higher median, and 32 shards took about 2.47 times as long as one.
Eight shards had the lowest median for 1,440 tests
| Shards | Total execution pods | Median | Observed range | Speedup |
|---|---|---|---|---|
| 1 | 2 | 368.3 s | 342.3 to 385.7 s | 1.00x |
| 4 | 5 | 292.3 s | 187.8 to 305.1 s | 1.26x |
| 8 | 9 | 188.8 s | 169.4 to 203.4 s | 1.95x |
| 32 | 33 | 350.2 s | 326.9 to 375.5 s | 1.05x |
Eight shards had the lowest median in the larger-suite sample, with a 1.95x speedup over one shard. Four shards had a median 21% lower than the baseline; 32 shards had a median about 5% lower. The observed ranges show the variation within each configuration and should be read alongside the medians. The unusually fast 187.8-second four-shard run had the same sampled placement as the other four-shard runs: three shard pods on node-1 and one on node-2. The retained diagnostics do not include continuous background-load telemetry, so the difference cannot be attributed to placement or background load.
“Total execution pods” counts the main pod plus one per shard over the run. It is not simultaneous concurrency. With five shard pods and two workers per pod, the configured maximum is ten concurrent Playwright workers.
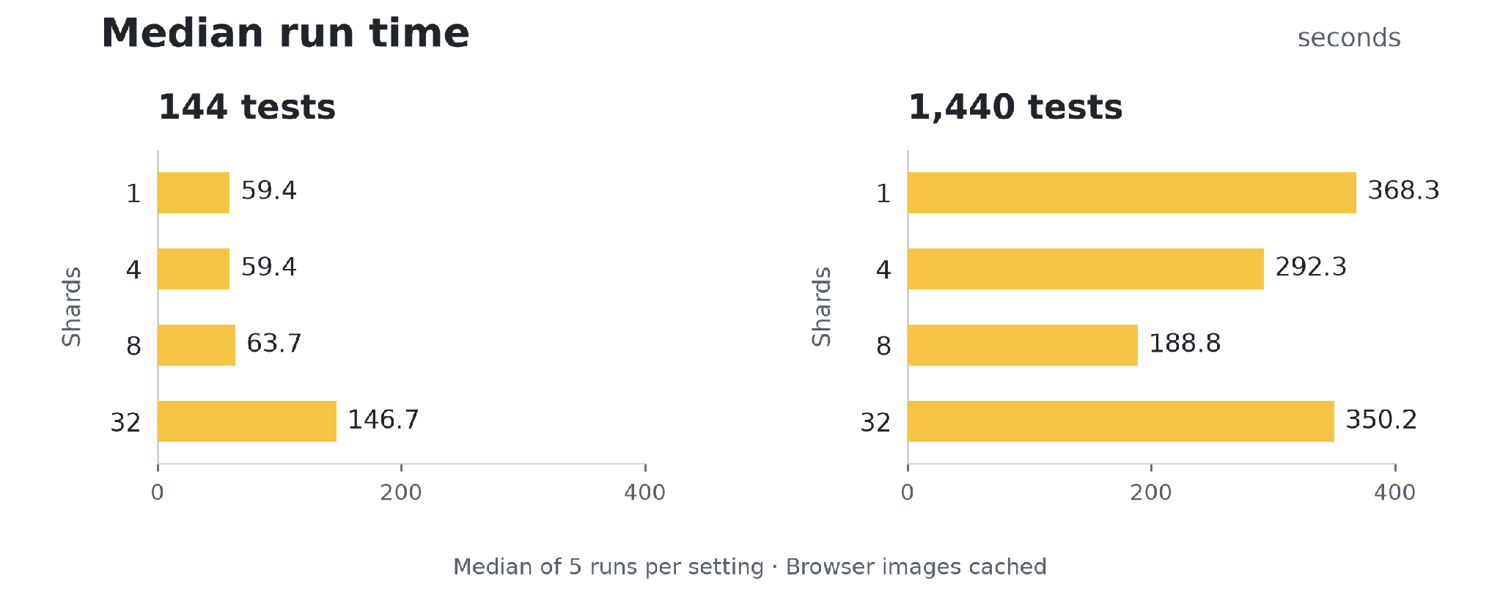
Median total execution time across five CLI observations per configuration, with browser images cached on both nodes. Shorter bars mean less time. The tables report the observed ranges.
All 40 Testkube workflows passed. Their downloaded HTML reports contained the expected 144 or 1,440 tests, with no unexpected failures, flakes, or skips. All 40 CLI timings are included in the summaries. One post-watch diagnostic query was interrupted by a local DNS failure after its CLI timing interval had ended. Execution-scoped polling observed every expected main and shard pod, with no containers observed in an OOMKilled state and no observed FailedScheduling events. These are polling observations, not a complete historical record of all container states or events.
What changed from the original measurements
In my original two-run sample, the midpoints of the two large-suite observations were 261.5 seconds for one shard, 236.5 for four, 164 for eight, and 314 for 32. Four and eight both improved on that baseline. The midpoints of the two initial small-suite observations were 47, 49, and 116.5 seconds at one, eight, and 32 shards; four shards were not tested in that sample. All original timings are retained separately in the benchmark data and methodology.
The seventh large-suite execution used 32 shards. Its watcher completed successfully and recorded a 350.180-second CLI duration. A subsequent status query failed when the benchmark client lost DNS access, but that query occurred outside the CLI timing interval. The workflow was later confirmed as passed. I retained the timing while marking the associated post-run diagnostics as interrupted; the execution was not repeated. The five-observation 32-shard median is 350.180 seconds, a roughly 1.05x speedup over the one-shard baseline. Eight shards still had the lowest median. The remaining configurations continued in their original randomized order.
The new results are not pooled with those earlier observations. Other cluster workloads remained active during the follow-up, and all five four-shard small-suite runs placed three shard pods on one node and one on the other. Small-suite durations also drifted upward across blocks. Thermal throttling was not controlled, and the observations do not isolate background load, CPU contention, thermals, or placement as the cause.
The repeated series provides more evidence than the original two-run sample, but this remains an exploratory study on a shared cluster. Randomization reduces dependence on a fixed configuration order; it does not remove changes in background load. A stable recommendation would require further controlled measurements if the decision depends on a small timing difference. Retain unsuccessful runs and incomplete diagnostics when repeating the experiment, rather than reporting only favorable timings.
Why adding shards can make the workflow slower
The work in this manifest happens at different frequencies:
| Cost | When it occurs |
|---|---|
Repository checkout and npm ci | Once in the main execution pod |
| Pod startup and repository transfer | For each shard instance |
| Playwright runner and worker/browser startup | Within each shard execution |
| Blob retrieval and report merging | Collection across shards, followed by one merge |
| Browser image download | When an eligible node lacks the required image layers, subject to pull policy |
In the original environment, I observed image pulls taking 34 and 52 seconds on the two nodes. Those timings are separate observations. They are excluded from the warm-cache benchmark and cannot explain its 32-shard slowdown.
With unlimited resources, splitting useful work among more shards can reduce each shard's test time. Fixed startup overhead creates diminishing returns. That simplified model alone does not predict increasing duration.
The concurrency cap changes the calculation. Thirty-two shard instances must pass through five concurrent slots. As slots free up, more instances start and pay their own startup and transfer costs. The cluster also performs more total orchestration work, while useful test work per shard gets smaller. Unequal shard durations and resource contention can extend the final completion time further.
Placement deserves attention. In an original four-shard run, three pods landed on one node and one on the other. The lone pod finished in 59 seconds; the three colocated pods took about 199 seconds each. That observation is consistent with contention, but does not isolate CPU as the sole cause.
The 250m request did little to express the CPU demand of two workers. Measure a more representative request and repeat the benchmark before recommending it. For multi-node clusters, evaluate topology spread constraints or appropriate affinity rules so placement does not concentrate test work unnecessarily. Placement rules must use labels that select the intended workload, and restrictive rules can leave pods pending.
The 144-test suite did not benefit at eight or 32 shards. Suite duration alone is not enough to choose a shard count: a different workload, runner, or existing CI layout can have a different break-even point.
Troubleshoot pending pods and browser failures
Start with the exact affected pod and container. Use names from the selected execution:
POD_NAME="replace-with-pod-name"
CONTAINER_NAME="replace-with-container-name"
kubectl -n testkube describe pod "$POD_NAME"
kubectl -n testkube logs "$POD_NAME" -c "$CONTAINER_NAME"
For a restarted container, add --previous when retrieving its preceding logs. Keep the Kubernetes context aligned with the environment that ran the workflow.
Pending pods: inspect scheduling events, per-node requested resources, taints, and placement constraints. Testkube's concurrency cap limits admitted shard instances; it does not guarantee the Kubernetes scheduler can place them.
OOMKilled containers: inspect termination reasons, memory usage, and the configured limit. In my original forced failure, four workers ran with a 768Mi memory limit, and both shard containers were reported as OOMKilled with exit code 137. That demonstrates a limit-related failure in this workload. Changing the request at the same time does not prove that the request caused it. Exit code 137 alone is also insufficient to diagnose OOM.
Evicted pods: read the eviction reason and node-pressure events. Eviction is not interchangeable with a container's OOMKilled termination reason.
Chromium or page crashes: inspect browser output and /dev/shm before assuming the whole container exceeded its memory limit. Compare the /tmp workaround with a dedicated shared-memory volume under controlled conditions.
Timeouts under load: inspect contention, application readiness, waits, and test-data isolation. Retries can help diagnosis, but should not replace fixing a repeatable failure. If you select tracing on the first retry, configure a retry; this example uses zero retries.
When a managed scraping API helps
This example is suited to tests against an application you control. It does not benchmark access to third-party sites, proxy performance, or extraction success.
Adding pods does not necessarily add public IP addresses. When a cluster uses network address translation (NAT) to send requests through one public address, those requests can share an IP-based rate limit. More browser capacity alone will not fix that. ScrapingBee's guide to making Playwright scraping scripts faster covers performance within the scraper, while its guide to scraping without getting blocked discusses access-related constraints.
For permitted workflows such as monitoring public product prices and listings, ScrapingBee can provide JavaScript rendering, proxy options, geolocation, and scripted page interactions through an API. Select the features appropriate to the target and verify the returned content. See the ScrapingBee API documentation.
| Consideration | Self-managed Playwright | Managed scraping API |
|---|---|---|
| Test execution | Control over the runner, fixtures, assertions, and browser lifecycle | Check whether the API's interaction model fits the data task |
| Browser and proxy operations | Your team maintains the infrastructure | Provider operates the supported browser and proxy service |
| Application responsibility | Tests, infrastructure, extraction, validation, and monitoring | API integration, extraction requirements, validation, and monitoring |
| Cost comparison | Include compute, idle capacity, storage, network, tools, and engineering time | Include request credits, selected features, and integration work |
The timing experiment does not establish which option is cheaper. A useful comparison measures the cost of a successful test run or correctly extracted record, including operational work.
For third-party scraping, check authorization, site terms, privacy obligations, and applicable law, and use an official API where appropriate. Tooling does not grant permission to collect data. The Playwright image used here is intended for testing; deployment against untrusted sites also requires a separate browser-isolation and security review.
Start with a baseline and measure each change
Build one complete execution first: checkout, tests, blob collection, and an inspectable report. Then vary the shard count while holding the suite, resource settings, and cache conditions constant.
The follow-up small-suite medians were effectively tied at one and four shards, while eight shards produced the lowest median for the larger suite. The results also changed from the original sample, which makes repeat measurement essential. Check startup and transfer overhead, concurrent worker demand, pod placement, and the slowest shard before choosing a configuration.
Keep the companion workflow and benchmark instructions aligned with the exact source and configuration you run. A faster test step is useful only if the full execution finishes sooner and produces complete, trustworthy results.
Frequently asked questions
How many Playwright shards should I run on Kubernetes?
Measure several counts within the CPU and memory capacity available to the workflow. Separate the total shard count from concurrent shard pods and workers per pod. Eight shards had the lowest median in the follow-up large-suite sample. Treat that as a result to investigate on your own workload.
Can Testkube standalone mode run this workflow?
No. This workflow uses parallel steps, which require a connected agent. The control plane can be Testkube Cloud or an on-premises deployment.
How do I merge Playwright reports from different pods?
Enable the blob reporter, collect that execution's ZIP files with their generated names, and run npx playwright merge-reports --reporter=html against the collected directory. Check for missing shards before treating the report as complete.
Does a low memory request cause OOMKilled?
A request influences scheduling; it is not a memory-use cap. Check the container's limit and termination details for an OOM diagnosis, and investigate node-pressure eviction separately. A Chromium shared-memory crash can occur without the container being OOMKilled.

Pablo del Arco is a cloud engineer and technical writer based in Valencia, Spain. He builds Kubernetes and edge infrastructure for EU innovation projects and writes hands-on guides on web DevOps, automation, and AI agents.