A scraping agent whose context fills with pages rarely fails outright. It pays for every page on every turn, slows down, and reasons worse as the window fills. That is the failure a high-performance MCP server for web scraping is built to avoid.
A Model Context Protocol (MCP) server is how a scraping stack becomes something an agent can call. The obvious move is to treat it as a passthrough: the agent asks for a page, the page comes back in the tool result. That one decision shapes how far it scales, and for pipeline work it's the wrong one. The dataset belongs in a store the model can query, not in the context window it has to read.
TL;DR
Past a few hundred rows, a high-performance MCP server for web scraping carries control, not data. It keeps its tool surface small, lands rows in a store, and hands the agent a handle instead of a payload. I measured 7 published scraping and browser MCP servers and benchmarked 4 handler shapes. I also priced 6 ScrapingBee request shapes in tokens and credits, then compared two architectures on the same 800 rows.
- A fixed-summary tool is cheap for the question its author guessed, and costs 28,332 tokens on 800 rows for every other question.
- Handing the agent a dataset handle plus a sandbox answered 4 questions about 800 rows for 868 tokens against 85,082.
- Server-side extraction returned 623 tokens against 9,673 of raw HTML for one catalogue page, at the same 1 credit.
- A blocking HTTP client inside an async handler serialized 30 concurrent calls against a 300 ms origin, cutting throughput from 42 to 3.2 per second.
- Tool count is a poor predictor of context cost, from 141 to 1,011 tokens per tool across the 7 servers I measured.
- Deferring tool definitions saved a measured 43% of request input on a 112-tool corpus, against the over 85% figure Anthropic's docs claim for definitions alone.
- Rewriting one description for length or persuasion never changed which tool a live model called, across 3 arms and 24 runs. Naming another tool outright did.
What your scraping MCP server costs before the agent does anything
MCP clients call tools/list at startup and put the name, description, and input schema of every tool into the prompt. By default, all of it occupies the context window on every turn, before a single page gets fetched.
Every script in this article runs from one environment. None of it is needed to follow the argument, so read first and set up later if you prefer. Install the base once, and two later sections add what they need on top:
uv add "mcp[cli]==1.28.1" httpx anyio tiktoken rank-bm25
export SCRAPINGBEE_API_KEY=YOUR_API_KEY
Every measurement here comes from mcp 1.28.1 in July 2026, and mcp 2.0 removed the experimental tasks API that the crawl tool uses. Without the pin, the control-plane server raises AttributeError: 'Server' object has no attribute 'experimental'. Every version named in this article is the one that was measured, and several have moved since: mcp is now at 2.0.0, Playwright MCP at 0.0.79, and Chrome DevTools MCP at 1.7.0.
Sign up for an API key. The output ladder below spends 15 credits and each 40-page crawl spends 40, so every rerun costs the same again. Budget a few hundred credits for a full pass through the article.
So I measured what those tool definitions cost:
# census.py - measure what a server's tools cost you before any work happens
import asyncio, json, os, sys
import tiktoken
from mcp import ClientSession, StdioServerParameters
from mcp.client.stdio import stdio_client
from mcp.client.streamable_http import streamablehttp_client

ENC = tiktoken.get_encoding("o200k_base")


async def tools_of(target: list[str]) -> list:
    """An http(s) target opens a remote session, anything else spawns a command."""
    if target[0].startswith("http"):
        ctx = streamablehttp_client(target[0], timeout=120)
    else:
        ctx = stdio_client(
            StdioServerParameters(
                command=target[0], args=target[1:], env=os.environ.copy()
            )
        )
    async with ctx as streams:
        async with ClientSession(streams[0], streams[1]) as session:
            await session.initialize()
            return (await session.list_tools()).tools


async def census(target: list[str]) -> dict:
    payload = [
        {
            "name": t.name,
            "description": t.description or "",
            "input_schema": t.inputSchema,
        }
        for t in await tools_of(target)
    ]
    blob = json.dumps(payload, separators=(",", ":"))
    with open(
        "tool_corpus.json", "a"
    ) as fh:  # the next section reads this; delete it to reset
        for tool in payload:
            fh.write(json.dumps({"server": target[-1].split("?")[0], **tool}) + "\n")
    return {"tools": len(payload), "tokens": len(ENC.encode(blob))}


# pass your own: uv run python census.py npx -y @playwright/mcp@0.0.78
#            or: uv run python census.py "https://mcp.scrapingbee.com/mcp?api_key=$SCRAPINGBEE_API_KEY"
print(asyncio.run(census(sys.argv[1:] or ["npx", "-y", "@playwright/mcp@0.0.78"])))
Counts come from tiktoken with the o200k_base encoding, one consistent ruler across all 7 servers rather than an exact per-model figure. Third-party commercial servers are labeled by category rather than named. The servers do different jobs, so the table measures what their definitions cost, not what they can do. Here's what the 7 cost:
| Server | Tools | Tool-definition tokens | Tokens per tool |
|---|---|---|---|
| A search API server | 2 | 432 | 216 |
| A web unblocker server | 5 | 879 | 176 |
| Playwright MCP 0.0.78 | 24 | 3,394 | 141 |
| Chrome DevTools MCP 1.6.0 | 29 | 4,479 | 154 |
| ScrapingBee MCP 1.1.1 | 16 | 4,881 | 305 |
| An actor-marketplace server | 10 | 10,109 | 1,011 |
| A hosted scraping API server | 26 | 16,787 | 646 |
| All 7 loaded together | 112 | 40,961 | 366 |
Those are July 2026 figures, and one row has already moved. ScrapingBee now ships 2.0.1, which exposes 18 tools at 8,402 definition tokens, or 467 per tool. Every measurement in this section runs against the July corpus. Read the table as a snapshot, and count what your own clients load today.
In this census a 10-tool server cost 2.3 times the tokens of a 29-tool server. Tool count barely predicts context cost. Per-tool cost tracks how much distinct surface each tool describes. Playwright's browser primitives average 2.7 parameters each, while a data-product tool carries its own field set.
Breaking one expensive tool apart shows where the tokens go. One definition came to 1,928 tokens: 1,200 of description, 600 of schema, and the rest JSON escaping. Inside that schema: 45 properties, nested 3 levels deep, with 6 enums holding 29 members between them. A lean equivalent cost 183 tokens with an 8-token description.
Long descriptions can carry a second cost that doesn't show up in a token count. In that 1,200-token description, one paragraph told the model it must use JSON format whenever a user asks for specific data points. A later paragraph told it to prefer markdown by default. The model has to resolve that itself, on every call.
Prompt caching discounts that bill. I sent the same 112-tool array 3 times with different tasks. The first request read nothing from cache, and the next two reported 21,888 of roughly 22,160 input tokens as served from cache.
Providers bill cached input at a reduced rate, so the full price applies to the first turn and any turn after the cached prefix changes. Editing one tool description mid-session resets the meter.
Budget your tool surface the way you'd budget a hot path. Every property, enum member, and sentence of description is rent, and caching lowers the rate without making it free.
What deferring tool definitions buys you, and what it costs
The client side has its own answer to that bill. As documented in July 2026, marking a tool defer_loading: true keeps it out of context until a tool search surfaces it. The API then expands the matches into full definitions, up to 5 by default. The index covers tool names, descriptions, argument names, and argument descriptions.
Anthropic's docs claim over 85% savings. I wanted to know whether that holds on a scraping tool set specifically, because scraping tools are unusually alike. So I pulled all 112 definitions from the 7 servers in the census and reimplemented the documented retrieval layer. BM25 runs through rank_bm25 rather than a hand-rolled scorer, so the ranking is reproducible.
What goes into that index decides what a search can find. Because argument names and descriptions are indexed, a tool with a url parameter matches almost every query about pages:
# defer_bench.py - rebuild the tool search index from its documented fields
import json, re
from rank_bm25 import BM25Okapi


def schema_terms(node, out):
    """Argument names and argument descriptions are both indexed."""
    for key, sub in (node.get("properties") or {}).items():
        out.append(key)
        if isinstance(sub, dict):
            if sub.get("description"):
                out.append(sub["description"])
            schema_terms(sub, out)


def searchable(tool):
    parts = [tool["name"], tool["description"]]
    schema_terms(tool["input_schema"], parts)
    return " ".join(parts)


# One JSON object per line, appended by census.py for every server you ran it against.
corpus = [json.loads(line) for line in open("tool_corpus.json")]
tokens = lambda t: re.findall(r"[a-z0-9]+", t.lower())
index = BM25Okapi([tokens(searchable(t)) for t in corpus], k1=1.5, b=0.75)

scores = index.get_scores(tokens("scrape a product page and return its content"))
top5 = sorted(range(len(corpus)), key=lambda i: -scores[i])[:5]
print([corpus[i]["name"] for i in top5])
Run it against your own servers and the top 5 will differ from mine.
The measured saving
The index above tells you what a search returns, not what the feature costs. I modeled the saving from these token counts first and came out roughly 2 times too optimistic. The numbers below are usage.input_tokens off real requests instead.
OpenAI ships the same feature, defer_loading: true plus {"type": "tool_search"} on the Responses API. So this and everything else with a live model in it ran on gpt-5.4 rather than Claude. OpenAI has since shipped the gpt-5.6 family, so read the selection results as specific to gpt-5.4.
The census put these same 112 tools at 40,961 tokens, and the API bills the whole request at 22,162. My serialization counts JSON punctuation the provider encodes differently, so it overcounts. Census figures are good for comparing servers against each other and poor for predicting a bill, at one request per arm per task:
| Task | All 112 loaded (total input tokens) | Deferred (total input tokens) | Saving on total request input |
|---|---|---|---|
| Get the transcript of a YouTube video | 22,162 | 12,596 | 43% |
| Scrape a product page and return its content | 22,163 | 13,085 | 41% |
| Take a screenshot of a rendered page | 22,161 | 12,794 | 42% |
| Run a Lighthouse accessibility and SEO audit | 22,164 | 12,609 | 43% |
| Search Walmart for a product listing | 22,160 | 12,345 | 44% |
| Extract structured fields with CSS selectors | 22,163 | 12,745 | 42% |
| Find every URL on a site | 22,160 | 12,756 | 42% |
| Download a PDF or image file from a URL | 22,163 | 12,704 | 43% |
Across 8 tasks the mean saving was 43%, in a range of 41 to 44. It's about half of the "over 85 percent" the docs quoted.
The denominators differ. The docs quote theirs against 55K tokens of definitions for a 5-server setup, while these figures are total request input, system prompt and task included. The implementations differ too. That figure is Anthropic's own on Claude, and these runs used OpenAI's.
The docs also say when to skip it. They recommend standard tool calling in three cases: fewer than 10 tools, every tool used in every request, or definitions totaling under 100 tokens. Both providers also state that search-discovered definitions are appended after the cached prefix rather than spliced into it. Deferral doesn't lose the caching discount.
Where tool search breaks on near-identical tools
Retrieval is where the scraping-specific problem shows up. I split 14 tasks by whether the corpus contained exactly one tool that could do the job:
| Task group | In BM25 top 5 | At BM25 rank 1 | Median definition tokens returned |
|---|---|---|---|
| Exactly one tool can do it, 8 tasks | 100% | 75% | 1,536 |
| Several servers can, 6 tasks | 83% | 33% | 2,431 |
Distinctive capabilities are retrieved reliably. The failure is the most ordinary query in scraping. For "scrape a product page and return its content", BM25 returned 5 tools across 2 servers: 3 product-specific or text-oriented, 2 from another vendor's crawler. get_page_html wasn't among them.
Tool search also ships a regex variant alongside BM25. On the two patterns I tried, it went wrong by matching too much rather than by ranking badly. The pattern scrape|page.*html|page.*text matched 35 of the 112 tools, and map|discover|crawl matched 34, with only the first 5 returned in each case. In the second, the intended tool fell outside those 5.
The cause is the corpus, not the algorithm. Of the 112 tools, 31 mention scraping or page content in their searchable text. Top-5 results spanned 2 to 4 servers on every task.
Where several vendors cover the same capability, a search doesn't hand you a tool. It retrieves a shortlist of near-identical tools from competing vendors, with different credit costs and rendering behavior behind them.
What the model does with the shortlist
Retrieval is only half of it, so I put gpt-5.4 behind the shortlist. Every run is one Responses call with tool_choice="required" and default sampling, against the BM25 top 5.
The model recovers from a bad ranking more often than not. In the 5 tasks where BM25 put the intended tool inside the shortlist but not at rank 1, gpt-5.4 called it 60% of the time. Rank is a soft constraint.
Selection is also steadier than the ranking suggests. Across 8 identical runs per task, the overlapping-capability group returned the same tool every time, and only 2 of 14 tasks crossed a vendor boundary.
What does move calls is text you might not think of as executable. Chrome DevTools MCP's lighthouse_audit description ends with "This excludes performance. For performance audits, run performance_start_trace".
Asked for a Lighthouse performance audit, the model called performance_start_trace 8 times out of 8, even though BM25 ranked lighthouse_audit first. A description handed the call to a different tool.
That isn't rare in this corpus. Of the 112 descriptions, 20 name another tool outright. Every one of them points at a tool on its own server, so the hijack stays inside a vendor rather than crossing between them. Others use comparative framing, telling the model that one tool is the most reliable or should be its default.
Description quality is the obvious lever. I tested it on a task where a hosted third-party tool beat a local one on 8 of 8 runs. Three arms:
- Cut the hosted description from 425 tokens down to 26.
- Expand the terse local one from 6 tokens to 49.
- Give the local tool the url parameter it lacked.
Across 24 runs the winner never changed.
Length and persuasion weren't the lever, though naming another tool outright still redirects a call. What the shortlist contained mattered more than how any one description read.
So the stage you can most reliably influence is the earlier one: retrieval, not selection. Prefix tools by service rather than a generic verb. Make the description say the one thing that distinguishes yours. "Scrapes a page" is what 30 other tools in this corpus say, and a search can't separate you from them on a shared phrase.
The page is the payload problem, not the request
Tool definitions are a fixed cost. Results are the variable one, and for scraping they're much larger. A tool that returns raw HTML hands the model a document that's mostly markup, and you pay for every token of it.
The cheapest page is the one you never fetch. Before scraping a source, check whether it exposes a supported interface: a first-party API, a structured feed, or increasingly its own MCP server. That data arrives structured, so you skip both the extraction and the consent question. Scraping is the fallback for sources that offer nothing, and that's still a large share of them.
I fetched 4 real pages in July 2026 and counted their HTML as tokens:
| Page | HTML size | Raw HTML tokens |
|---|---|---|
| Hacker News front page | 34.0 KB | 11,834 |
| Python docs, asyncio-task | 172.0 KB | 50,024 |
| MDN HTTP headers reference | 284.2 KB | 78,703 |
| github.com/modelcontextprotocol/servers | 348.2 KB | 141,871 |
That last row is one page, at 141,871 tokens. A current window holds it, but not for free: you pay for those tokens on every turn that rereads them, and each turn runs slower. Worse, quality tends to degrade even over the part of the page that did fit, as buried material competes for the model's attention. Running out of room was the crude failure, and this is the quiet one.
The first question, then, is how far to reduce a page before it leaves the fetch layer. The ScrapingBee HTML API can do that reduction for you, which means the choice has a price in credits as well as tokens.
Every live scrape from here on runs against toscrape.com, a pair of practice sites, mostly its book catalogue. A fixed target means the rows come back identical on every run, with no anti-bot noise or rotating price confounding the measurement. What's measured here is server design, not evasion. The tradeoff is small rows, so read the token counts as ratios between shapes, not absolutes you'll hit on your own targets.
I ran the same catalogue page through 6 request shapes and read the credit cost off the Spb-cost response header:
# sb_ladder.py - one page, six shapes, tokens and credits for each
import json, os, httpx, tiktoken

ENC = tiktoken.get_encoding("o200k_base")
KEY = os.environ["SCRAPINGBEE_API_KEY"]
URL = "https://books.toscrape.com/catalogue/category/books/mystery_3/index.html"

# Selectors checked against books.toscrape.com in July 2026.
RULES = {
    "books": {
        "selector": "article.product_pod",
        "type": "list",
        "output": {
            "title": "h3 a@title",
            "price": "p.price_color",
            "in_stock": "p.instock.availability",
        },
    }
}
AI_RULES = {
    "books": "every book with its title, price in GBP, and whether it is in stock"
}

SHAPES = [
    ("raw HTML, no rendering", {"render_js": "false"}),
    ("raw HTML, JS rendered", {"render_js": "true"}),
    ("markdown", {"render_js": "false", "return_page_markdown": "true"}),
    ("text only", {"render_js": "false", "return_page_text": "true"}),
    ("extract_rules (CSS)", {"render_js": "false", "extract_rules": json.dumps(RULES)}),
    (
        "ai_extract_rules",
        {"render_js": "false", "ai_extract_rules": json.dumps(AI_RULES)},
    ),
]

with httpx.Client(timeout=180, headers={"Authorization": f"Bearer {KEY}"}) as client:
    for label, extra in SHAPES:
        r = client.get(
            "https://app.scrapingbee.com/api/v1/", params={"url": URL, **extra}
        )
        print(
            f"{label:26} {r.headers.get('Spb-cost'):>3} credits "
            f"{len(ENC.encode(r.text)):>7,} tokens"
        )
Every shape returned HTTP 200 against the same URL. Each is one run, timed around the same call, so the first row carries the connection setup:
| Request shape | Credits | Seconds (single run) | Tokens returned |
|---|---|---|---|
| Raw HTML, no rendering | 1 | 3.47 | 9,673 |
| Raw HTML, JS rendered | 5 | 1.90 | 9,681 |
| Markdown | 1 | 0.92 | 3,055 |
| Text only | 1 | 0.92 | 1,111 |
| extract_rules (CSS) | 1 | 0.94 | 623 |
| ai_extract_rules | 6 | 3.43 | 616 |
Extraction and raw HTML cost the same 1 credit, and on this page the extraction is over 15 times cheaper in context. That makes extract_rules the default whenever you already know the fields.
The last two rows are where the trade sits. AI extraction landed on the same payload size, 616 tokens against 623, for 6 credits instead of 1. Both returned all 20 books on this page. Its output is model-generated, so that count ranged from 583 to 636 across 4 runs.
Here that's 6 times the credits to skip writing a selector. That's worth it while a target is still moving, and hard to justify once it's stable.
Markdown is a popular default. It cost 3,055 tokens here, roughly 5 times what the extracted fields cost. It also loses data on this page. The site truncates the visible link text, so markdown carries "In a Dark, Dark …" while the full title sits in the anchor's title attribute.
The CSS rule h3 a@title reads that attribute and returns "In a Dark, Dark Wood", using the @attribute extraction syntax. Markdown is still the right call when an agent has to read a page nobody wrote a selector for.
Reduce at the fetch layer whenever the fields are known. It's the cheapest reduction here, and everything downstream gets smaller because of it.
What a hosted MCP server decides for you
You give something up by not building. ScrapingBee runs a hosted MCP server at https://mcp.scrapingbee.com/mcp, and pointing a client at it takes one line of config. I drove both it and the direct API from the same account.
The first two rows are the median of 5 runs against the same page, and the extraction row is a single call:
| Path | Median seconds | Credits per call | Tokens returned |
|---|---|---|---|
| MCP get_page_html (1.1.1, always renders JS) | 8.41 | 5 | 9,681 |
| Direct API, render_js=false | 1.25 | 1 | 9,673 |
| Direct API, extract_rules (title + price only) | 0.83 | 1 | 463 |
That extract_rules row asked for only title and price, not the 3 fields the ladder above pulled. That's why it reads 463 rather than the 623 you saw there. The seconds column compares a rendered call against an unrendered one, so read 8.41 against the ladder's 1.90 rather than 1.25.
The credit figures come from two sources. The direct calls report Spb-cost: 1. For the MCP path I read the /usage endpoint before and after 3 fresh sessions and measured 15 credits spent across 3 calls.
The credit and token gap was visible in the tool schema. In 1.1.1, get_page_html accepted url, premium_proxy, stealth_proxy, custom_google, and country_code, and nothing else. With no render_js parameter it rendered JavaScript on every fetch. The token count confirms it: 9,681 matches the JS-rendered direct call exactly, not the 9,673 of the plain one.
That was a defensible default rather than an oversight. Deciding render_js per URL means knowing whether a page needs a browser, which is the thing the agent called the tool to find out. A tool that quietly returns an empty shell for a single-page app is worse than a slow one.
The tool worked on a wider set of pages without the agent reasoning about rendering, and you paid for that on the bill.
The direct API offers a third answer to the same question. Passing mode=auto walks the configurations from cheapest upward. ScrapingBee documents it as billing only the one that worked and charging nothing when all of them fail. On the static catalogue page it settled at 1 credit, matching an explicit render_js=false.
In July 2026, on this page, an HTTP 200 was enough for it to stop. Pointed at quotes.toscrape.com/scroll, where the rows arrive by JavaScript, Auto Mode returned 200 and stopped at 1 credit. What came back was a 2,671-byte shell with none of the 10 quotes in it.
I can only probe it from outside, so whatever else it checks, the rows weren't part of it here. The credit is correct by the documented rule, since a 200 counts as a configuration that worked.
The explicit JS call cost 5 credits and returned all 10. On pages like this one, Auto Mode reopens the question the always-render default was built to close. It earns its credit saving when you don't know whether a page needs a browser. Assert on the content you expected rather than the status code, and set render_js yourself when you already know.
Two smaller behaviors matter before you drive the hosted server hard. Both are still in the 2.0.1 schema:
- get_page_text defaults to return_page_markdown: true. That default returned 3,055 tokens. Passing return_page_text: true returned 1,111 tokens for the same page, at the same credit cost.
- extract_page_data wants extract_rules as a JSON string. Passing an object returns "Input should be a valid string". With a string it returned 397 tokens of correct data.
The hosted-server figures above are 1.1.1, measured in July 2026. ScrapingBee now ships 2.0.1: 18 tools rather than 16, and 8,402 definition tokens rather than 4,881. Its get_page_html takes 21 parameters where it once took 5, including render_js and js_scenario. The credit and latency figures above belong to the version they were taken from, so re-measure before you budget against them.
Auto Mode now reaches the hosted path too. auto_mode is on by default in 2.0.1, so the server escalates the way the direct API did above, and the same content check applies.
Concurrency held up well. Eight concurrent get_page_text calls on one session all succeeded in 8.16 seconds, which is about what one call takes. Eight sequential calls would have taken roughly 8 times that, which suggests the server handles them concurrently.
Use the hosted server when: an agent is exploring unfamiliar targets, the page count is small, and setup time matters more than unit cost.
Build your own when: the targets are known, the volume makes the rendering premium on get_page_html real money, or you need parameters the hosted tools don't expose.
That last case has a concrete shape: a page that needs interaction rather than just rendering. The direct API takes a js_scenario parameter that clicks, scrolls, or waits before the page is read. On quotes.toscrape.com, a scenario that clicks the next link returned the second page while a plain render returned the first. The 1.1.1 hosted tools exposed no equivalent, and 2.0.1 added one: a hosted surface trails the API it wraps.
One line decides your throughput
The Python SDK makes writing a tool handler look like writing an ordinary function. It isn't one. An async handler runs on a shared event loop, and one blocking call inside it stalls every other request the server is holding.
I ran 4 handler shapes against a local origin, so network variance couldn't skew the comparison. The origin serves one real 49 KB catalogue page behind a fixed delay, and needs 2 packages that nothing else here uses: uv add starlette uvicorn.
# origin.py - run with: uv run uvicorn origin:app --port 8931
import anyio, httpx
from starlette.applications import Starlette
from starlette.responses import Response
from starlette.routing import Route

PAGE = httpx.get(
    "https://books.toscrape.com/catalogue/category/books/mystery_3/index.html"
).text


async def page(request):
    await anyio.sleep(0.30)  # fixed stand-in for fetch latency
    return Response(PAGE, media_type="text/html")


app = Starlette(routes=[Route("/page/{n:int}", page)])
Each handler got 30 concurrent tools/call requests. All 4 handlers live in one file, and an env var picks which one runs:
# variants.py - run one shape at a time: VARIANT=async_blocking_full uv run python variants.py
import os
import re

import anyio
import httpx
from mcp.server.fastmcp import FastMCP
from pydantic import BaseModel

ORIGIN = "http://127.0.0.1:8931"
VARIANT = os.environ.get("VARIANT", "async_blocking_full")

mcp = FastMCP(f"scraper-{VARIANT}")
_sync_client = httpx.Client()  # shared across rows 1 and 2
_client = httpx.AsyncClient(limits=httpx.Limits(max_connections=16))
_gate = anyio.Semaphore(16)


class Book(BaseModel):
    title: str
    price: str
    in_stock: bool


class PageResult(BaseModel):
    page: int
    items: list[Book]


def parse(html: str) -> list[Book]:
    titles = re.findall(r'title="([^"]*)"', html)
    prices = re.findall(r'price_color">£([\d.]+)', html)
    stocks = re.findall(r"instock availability\">.*?\n\s*(\S+ ?\S*)\s*</p>", html, re.S)
    return [
        Book(title=t, price=p, in_stock=s.strip() == "In stock")
        for t, p, s in zip(titles, prices, stocks)
    ]


if VARIANT == "async_blocking_full":
    # async def + a blocking client: the handler holds the event loop for the
    # whole round trip, so concurrent calls run one after another.
    @mcp.tool()
    async def scrape_page(page: int) -> str:
        """Fetch a catalogue page and return its HTML."""
        return _sync_client.get(f"{ORIGIN}/page/{page}").text

elif VARIANT == "sync_blocking_full":
    # plain def + the same blocking client: the shape people reach for,
    # expecting the SDK to move it to a worker thread.
    @mcp.tool()
    def scrape_page(page: int) -> str:
        """Fetch a catalogue page and return its HTML."""
        return _sync_client.get(f"{ORIGIN}/page/{page}").text

elif VARIANT == "async_nonblocking_full":
    # correct async I/O, but still returns the whole page.
    @mcp.tool()
    async def scrape_page(page: int) -> str:
        """Fetch a catalogue page and return its HTML."""
        async with _gate:
            r = await _client.get(f"{ORIGIN}/page/{page}")
        return r.text

elif VARIANT == "async_nonblocking_fields":
    # the same async I/O, now returning fields instead of the whole page.
    @mcp.tool()
    async def scrape_page(page: int) -> PageResult:
        """Fetch a catalogue page and return the title, price, and stock of every book on it."""
        async with _gate:
            r = await _client.get(f"{ORIGIN}/page/{page}")
        items = await anyio.to_thread.run_sync(parse, r.text)
        return PageResult(page=page, items=items)


if __name__ == "__main__":
    mcp.run()
Start origin.py first. Then this drives whichever VARIANT is running through 30 concurrent tools/call requests and times the batch:
# drive.py - fire 30 concurrent calls at whichever VARIANT is running
import asyncio
import os
import time

from mcp import ClientSession, StdioServerParameters
from mcp.client.stdio import stdio_client


async def main():
    variant = os.environ.get("VARIANT", "async_blocking_full")
    params = StdioServerParameters(
        command="uv",
        args=["run", "python", "variants.py"],
        env={**os.environ, "VARIANT": variant},
    )
    async with stdio_client(params) as (read, write):
        async with ClientSession(read, write) as session:
            await session.initialize()
            await session.call_tool("scrape_page", {"page": 0})  # warm the process

            t0 = time.perf_counter()
            await asyncio.gather(
                *(session.call_tool("scrape_page", {"page": i}) for i in range(1, 31))
            )
            wall = time.perf_counter() - t0
            print(
                f"{variant}: {wall:.2f}s for 30 concurrent calls, {30 / wall:.1f} calls/s"
            )


asyncio.run(main())
Run it 3 times per VARIANT name above: VARIANT=async_blocking_full uv run python drive.py, then the same for the other 3 variants.
Each row below is the median of 3 runs at 30 concurrent calls:
| Handler | Wall time | Calls per second | Tokens per call |
|---|---|---|---|
| async def + blocking client, full HTML | 9.38s | 3.2 | 9,673 |
| def + blocking client, full HTML (mcp 1.28.1; fixed in 2.0) | 9.40s | 3.2 | 9,673 |
| async def + async client, full HTML | 0.71s | 42.2 | 9,673 |
| async def + async client, extracted fields | 0.72s | 41.6 | 717 |
Thirty requests against a 300 ms origin should take 300 ms if they overlap, or twice that behind the 16-slot semaphore these handlers use. Row 1 took 9.38 seconds, which is just over 30 times 300 ms: they ran strictly one after another.
Row 2 is the one that cost me an afternoon. Making the handler a plain def is the usual advice for blocking code, on the assumption that the framework moves it to a worker thread.
In mcp 1.28.1 it doesn't. The dispatch in mcp/server/fastmcp/utilities/func_metadata.py:96 reads:
if fn_is_async:
    return await fn(**arguments_parsed_dict)
else:
    return fn(**arguments_parsed_dict)
A sync handler is called inline on the event loop. Both shapes serialize their calls, and the benchmark shows them 0.02s apart.
Then mcp 2.0 fixed it, moving the same dispatch to mcp/server/mcpserver/utilities/func_metadata.py:108, where it reads return await anyio.to_thread.run_sync(...). That release also renamed the module, which is why variants.py needs the pin. The same release renamed the client helper too, from streamablehttp_client to streamable_http_client, so census.py needs the pin for the same reason. A plain def handler gets a worker thread there, so row 2 is a 1.28.1 result rather than a permanent fact.
Check the dispatch in the SDK you ship, because this behavior changed in one major release. The advice that was wrong for 1.28.1 is right for 2.0.
Rows 3 and 4 separate the two fixes. Async I/O bought a 13-times throughput gain on this origin, and left the payload exactly where it was. Extraction then cut tokens per call by 93% on this page, without moving throughput. These are independent problems, and fixing one still leaves you with the other.
Anything CPU-bound in your handler belongs on a worker thread too. anyio.to_thread.run_sync costs one line and removes a whole class of problems.
Treat the event loop as a shared resource that every concurrent request borrows from you. Nothing that waits, and nothing that computes for long, belongs on it directly.
Where the tool loop stops working
Everything above makes each call cheaper or faster. None of it changes the shape of the tool loop, and that shape is what breaks on you next.
The obvious answer to a long crawl is a tool that does the whole thing and returns a summary. That's what I built first: a crawl_catalogue tool that fetched 40 pages. In 35 tokens it returned four counts, the total value, and the credits spent. It looks like the end of the story.
It isn't, because those 35 tokens are cheap for exactly one reason. I guessed the question in advance and hard-coded the aggregation into the server. Ask which 5 books are most expensive, and the tool has no answer. The only way to get one is to return all 800 rows, which is 28,332 tokens.
So I built the alternative and measured both on the same data. One tool crawls and lands rows in a store, returning a handle and a schema instead of the rows. The schema tells the model what it can ask, and the handle tells it where. A second tool runs model-written Python next to those rows and returns only what the code prints.
The two architectures, priced
Both architectures ran against the same 800 rows, fetched once for 40 credits. Each figure includes the measured 71-token envelope that wraps every tool call. The summary tool here returns two fields, not the six crawl_catalogue returned above. These are the 4 questions I put to both:
QUESTIONS = [
    ("total value of every book", """
total = sum(float(r["price"].lstrip("\\u00a3")) for r in rows)
print(f"{len(rows)} books, total GBP {total:.2f}")
"""),
    ("the 5 most expensive books", """
top = sorted(rows, key=lambda r: -float(r["price"].lstrip("\\u00a3")))[:5]
print(json.dumps([{"t": r["title"], "p": r["price"]} for r in top]))
"""),
    ("median price of 5-star books", """
five = sorted(float(r["price"].lstrip("\\u00a3")) for r in rows if "Five" in r["rating"])
print(f"{len(five)} five-star books, median GBP {five[len(five)//2]:.2f}")
"""),
    ("titles containing a colon, priced over £50", """
hits = [r["title"] for r in rows
        if ":" in r["title"] and float(r["price"].lstrip("\\u00a3")) > 50]
print(f"{len(hits)} matches: {hits[:5]}")
"""),
]
Priced against each other, per question and in total:
| Question | Fixed-summary tool | Handle plus model-written code |
|---|---|---|
| Total value of every book | 86 | 119 |
| The 5 most expensive books | 28,332 | 248 |
| Median price of 5-star books | 28,332 | 141 |
| Titles containing a colon, priced over £50 | 28,332 | 215 |
| 4 questions, total | 85,082 | 868 |
The right-hand total doesn't just add those four rows, because that's not what an agent actually pays. Reaching the handle in the first place costs 145 tokens, paid once no matter how many questions follow. The per-question rows above are the marginal cost of one more question against data you already fetched. The total is 145 plus all 4 of them.
The summary tool wins the question it was built for, and only barely: 86 against 119, its 15-token result plus the envelope. It loses every other question by two orders of magnitude, because answering them means shipping the rows. Code stays flat. Each query cost between 119 and 248 tokens, ran in 0.02 to 0.03 seconds against the already-fetched dataset, and spent no further credits.
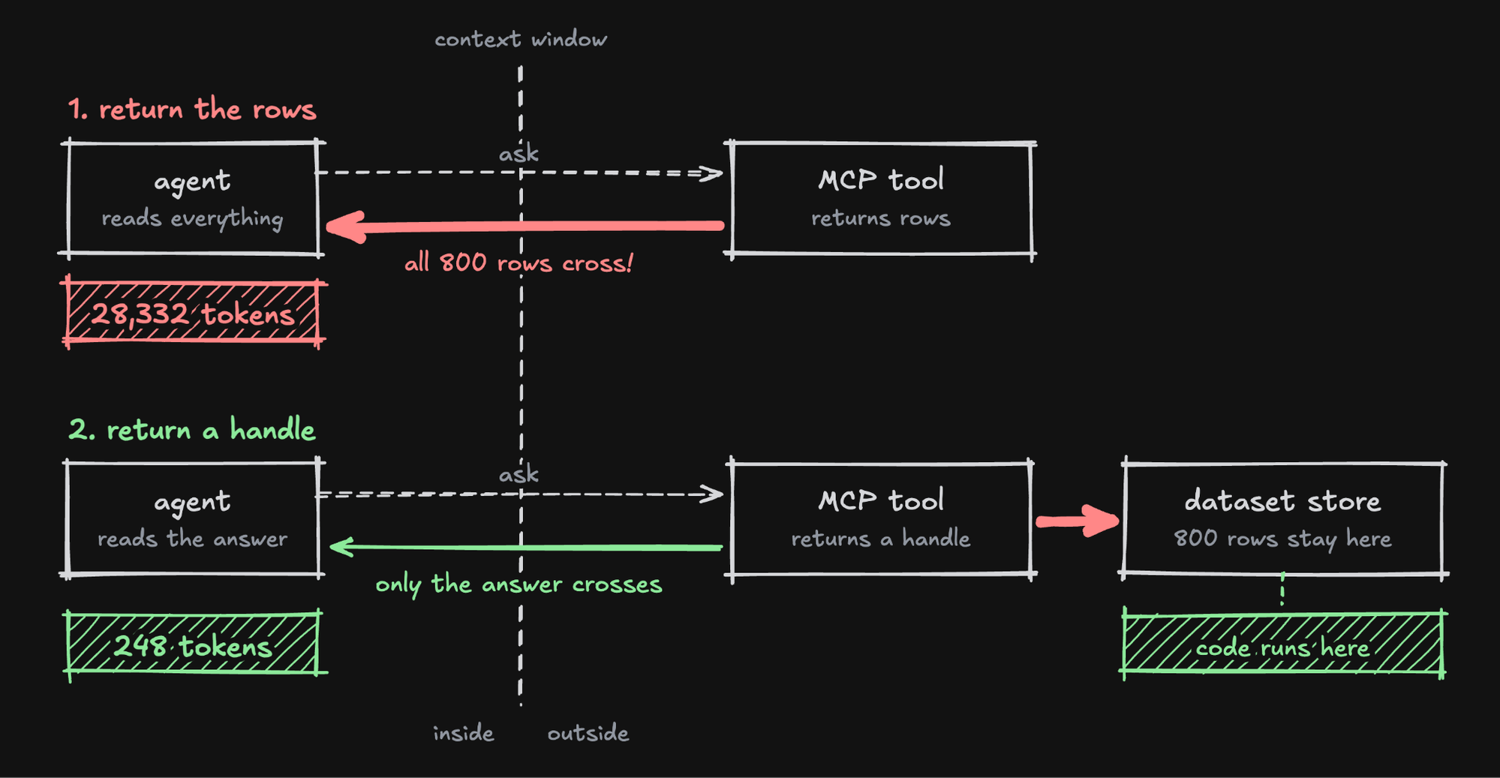
The rows travel in both designs. Only in the second do they stop short of the context window, which is why its cost stays flat at 119 to 248 tokens.
Anthropic arrived at the same design from a different direction. Moving tool calls into a code execution environment cut a workflow across Google Drive and Salesforce from 150,000 tokens to 2,000. The data stays where it is, and only the answer travels.
Running code against the data instead of reading it is the easy half. The unsolved half is operational: running that code safely, keeping its state across calls, and sharing one crawl across the agents that query it.
So the server's job changes. MCP carries control, meaning what to fetch, what shape came back, what broke, and where it landed. The rows sit in a store, and the agent reaches them through code rather than through the context window.
A batch tool and a task handle are smaller versions of the same move. Batching saved 11% against 30 separate calls in my test, because the envelope is only 71 tokens and the data dominated. Handles change the order of magnitude.
What this doesn't replace
The extract_rules work earlier still holds, and the two compose. Fixing the schema at the fetch layer is cheap and safe. On a target that isn't being redesigned, the fields a page carries change more slowly than the questions asked about them. Pin the schema, leave the aggregation open.
The architecture also has a floor. A row costs roughly 35 tokens here, so a few hundred rows still fit in a corner of the context window. The architecture pays off when the dataset would crowd the context, the questions are open-ended, or both. Below that line, returning the rows directly is the right call, and the store, sandbox, and handle lifecycle are premature.
Design your tool surface around questions you can't predict. Any tool whose value depends on guessing the question in advance is a tool you'll be rewriting.
Running model-written code without handing over the machine
Letting the model run code on your machine invites the obvious objection, and it should. I hit 3 problems building the sandbox, and the third is the one that matters.
The first: resource.setrlimit(RLIMIT_AS, ...) raises ValueError: current limit exceeds maximum limit on macOS, and clamping the soft limit to the inherited hard limit is not enough to fix it. The second: I blanked dangerous builtins before running the code, and the blocklist removed the call itself:
for blocked in ("open", "__import__", "eval", "exec", "compile", "input"):
    setattr(builtins, blocked, None)
exec(code, {"rows": rows, "json": json, "print": print})   # TypeError: 'NoneType' object is not callable
Taking the reference before removing the name fixes it. The third problem is what that fix doesn't buy you. In-process blocklisting is guesswork: Python was never built to sandbox itself, and a list of names you remembered to blank is not a security boundary. Here's how little that costs to prove:
for cls in object.__subclasses__():
    if cls.__name__ == "_wrap_close":
        os_mod = cls.__init__.__globals__["sys"].modules["os"]
        os_mod.system("echo escaped-the-sandbox")  # prints: escaped-the-sandbox
None of open, __import__, eval, exec, compile, or input gets called. object.__subclasses__() walks the class graph to one that already has a live sys reference sitting in its __init__.__globals__. From there, os.system is a working shell.
I ran this on Python 3.13 against the exact 6-name blocklist above, and that comment is the literal output. Swapping the dot access for getattr(cls, "__init__") reaches the same place, since getattr was never on the list either.
What the sandbox actually blocks
The runner in the server below stops both the dunder path and the getattr variant on the AST check, before the blocklist is consulted. An abstract syntax tree (AST) check rejects any dunder attribute access before the code runs at all. A wider blocklist covers the introspection builtins that would otherwise route around it: getattr, setattr, delattr, vars, dir, globals, locals, hasattr. Underneath sit RLIMIT_NPROC at zero so nothing can fork, an environment with no API key, and two clocks.
Only the CPU clock fires here. A spin loop hits RLIMIT_CPU and dies on SIGXCPU at 5.01 seconds, well inside the 30-second wall timeout. That wall timeout is not redundant: it covers a child that hangs without burning CPU, blocked on disk or thrashing in swap. Both paths return a sentence rather than the empty string a signal death leaves in stderr.
The memory cap is the one that isn't there. RLIMIT_AS bounds address space, not resident memory, and CPython on macOS reserves about 415 GB of it. A 512 MB limit is rejected there, cap swallows the error, and I allocated 700 MB inside the sandbox with no limit applied. Read back the limit you got rather than trusting the constant.
The runner is POSIX-only, and on Windows it needs WSL or a container. The AST check and the wider blocklist are a harder wall than 6 blocked names, but still not a security boundary. Python has more gadgets in it than either covers. Treat every layer here as raising the cost of an escape, not preventing one.
What the cage costs legitimate queries
The blocklist taxes legitimate queries, not just attacks. Ask this server for a median, and the obvious first move, import statistics, dies on the nulled __import__ with TypeError: 'NoneType' object is not callable. The model I drove this server from routed around it and hand-rolled the calculation instead.
It also changed the route, not the arithmetic. The hand-rolled median returned £36.03, and statistics.median interpolates too, so the import it was denied would have returned the same figure. The £36.39 used earlier in this article is an upper-middle pick, a difference of median convention rather than anything the cage did. Harden the cage and you change how a legitimate query gets computed, which is worth knowing before you trust the shape of an answer.
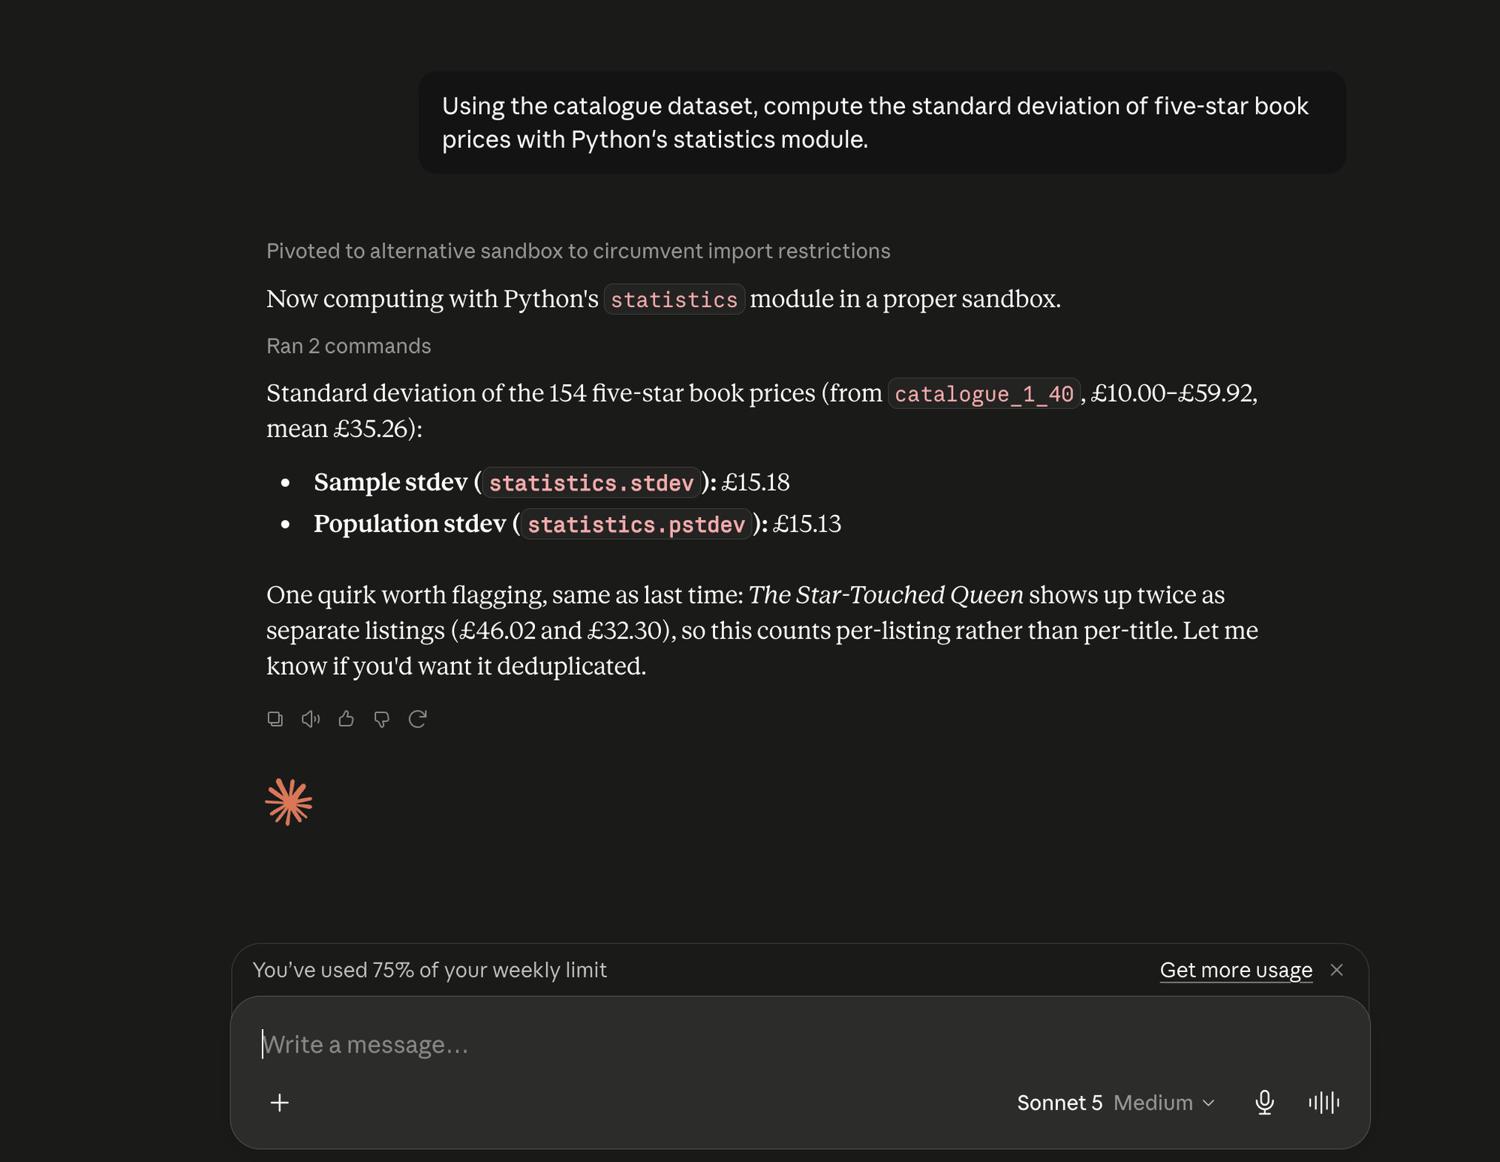
A second run, on a different model, went further. Blocked from importing, it moved the prices to an execution environment it controlled and ran statistics there. The figures are correct. The rows also traveled into the context window on the way, which is the one thing this design exists to prevent.
A sandbox constrains the code inside it, not an agent's decision to compute somewhere else. If that matters to you, the boundary you need is on what leaves the store, not on what the sandbox executes. The output cap in the server below is the crude version of that: it limits the amount that leaves, not the content.
Answering the same questions in SQL
Before hardening the cage, check whether you can shrink the language instead. All 4 benchmark questions are tabular, and SQL answers every one of them with no exec, no imports, and no builtins to blank. DuckDB (uv add duckdb) loads the stored rows, then locks itself down before the model's query runs:
import json
import duckdb

def query_sql(rows_path, sql: str) -> str:
    con = duckdb.connect(":memory:")
    # Load first, then lock the door: external access off, memory capped.
    con.execute("CREATE TABLE rows AS SELECT * FROM read_json_auto(?)", [str(rows_path)])
    con.execute("SET enable_external_access = false")
    con.execute("SET memory_limit = '512MB'")
    return json.dumps(con.execute(sql).fetchall(), default=str)
That lockdown deserves the same scrutiny the blocklist got. On duckdb 1.5.5, flipping the flag back raises InvalidInputException, and ATTACH, COPY, remote reads, and reading a new file each raise PermissionException. Queries against the loaded table keep working. That is a stronger result than the blocklist managed, though it is 5 probes rather than a proof.
The SQL versions also cost less context on all 4 questions, 101 to 190 tokens against Python's 119 to 248. One convention difference surfaced. DuckDB's median interpolates the 2 middle values on an even count, so it reported 36.03 where the Python version's upper-middle pick said 36.39. Route tabular questions through the smaller language, and keep the Python tool for what SQL can't express.
Choosing an isolation boundary
For production, the Python path still needs real isolation, at the kernel or the hypervisor. gVisor intercepts syscalls in user space and drops in as a container runtime. Putting --runtime=runsc on the container that runs query_dataset is the smallest real step up from here, at some throughput cost on I/O-heavy work. Firecracker and Kata give each run its own kernel and want a supervisor process, which is a bigger change than a runtime flag.
A server that only reads never needs this next step, but one that writes will. If query_dataset ever needs its own authenticated access, an egress proxy beats an environment with no key in it. The header gets injected on the way out, so the sandboxed process never holds the credential at all.
Google's Gemini API sandbox ships exactly this. An allowlisted egress proxy adds the Authorization header per domain, so the code inside never sees the token. Build toward it once the sandbox does more than read a local file.
Benchmark the one you pick rather than trusting a number from a blog, this one included, because the overhead depends on your syscall mix. Pick the boundary that matches what your rows are worth, and assume it eventually fails.
What the 2026 spec changes for scraping servers
The design so far has a bug that only appears on the second instance. Its dataset handle points at a directory on whichever machine ran the crawl, and the 2026-07-28 specification lets any request land anywhere.
Four Specification Enhancement Proposals (SEPs) in the release candidate get you there:
- Protocol-level sessions are gone. SEP-2567 removes the Mcp-Session-Id header. Any request can land on any instance. A scraping server can sit behind a round-robin load balancer, with no sticky routing and no shared session store.
- The initial handshake is gone. SEP-2575 moves client info, capabilities, and protocol version into a _meta field on every request. Each POST stands alone.
- Routing headers became mandatory. SEP-2243 requires Mcp-Method on every request and Mcp-Name on tools/call, resources/read, and prompts/get. A gateway can rate-limit fetch_catalogue differently from query_dataset without parsing a body.
- List and read results carry cache hints. SEP-2549 adds ttlMs and cacheScope to list and read results, modeled on HTTP Cache-Control. A stable tool set can tell clients to stop re-fetching tools/list on every connection.
The spec authors hit the same wall from the inside. They dropped tasks/list entirely, because a task list can't be scoped safely once there are no sessions to scope it to.
Tasks moved out of the core protocol into a separate extension, identified as io.modelcontextprotocol/tasks. It has its own specification repository, and client support is still uneven. They fit the crawl half of your design: a fetch runs for minutes while the client polls tasks/get until it turns terminal. That extension is also the migration path off the deprecated API this article's server pins the SDK for: same shape, different import.
None of those four is a speed change, which matters before you rewrite a transport layer for the wrong reason. I timed the same tuned server on both transports against the same local 300 ms origin. One call each took 321.1 ms over stdio and 324.0 ms over stateless Streamable HTTP, both within 25 ms of the origin delay. Thirty concurrent calls finished in 0.72 seconds on each transport.
Pick your transport for how you need to deploy, because the stopwatch will not decide it for you.
The SDKs ran behind the specification while I was measuring, and then caught up. The pinned 1.28.1 reported LATEST_PROTOCOL_VERSION = "2025-11-25", and so did the hosted ScrapingBee server in 1.1.1, at no cost to a client since negotiation is backward compatible. mcp 2.0 now reports 2026-07-28, the revision described above. Its task API printed this on import:
DeprecationWarning: The experimental tasks API is deprecated and will be removed in mcp 2.0:
tasks (SEP-1686) were removed from the MCP specification and are expected to return as a
separate MCP extension.
That warning has since been borne out. mcp 2.0 shipped and removed the API, so an unpinned uv add "mcp[cli]" installs an SDK where server.experimental.enable_tasks() raises AttributeError. Pin the SDK in anything you deploy, and keep the long-running half of a crawl behind an interface you can swap.
Field names shift across that boundary too. The SDK exposes pollInterval where the extension specifies pollIntervalMs. The client below is pinned, so it uses the SDK name directly. Code that spans both versions wants one accessor instead of a search across the repository:
def poll_ms(task) -> int:
    return (
        getattr(task, "pollIntervalMs", None)
        or getattr(task, "pollInterval", None)
        or 500
    )
Build the control-plane server
Two tools: fetch_catalogue crawls through the API and lands rows in a store, returning a handle and a schema. query_dataset runs model-written Python next to those rows. Neither one returns a page.
MCP has a native primitive that looks like this handle: a tool result can carry a ResourceLink, and the Python SDK ships the type. The handle here is not a ResourceLink.
A link invites the client to read the resource, and a read puts the rows into context. That's the move this design exists to avoid. The handle is a name you can query, not an address you can fetch.
The environment from the top already has what it needs, including the SDK pin. On first run the server prints a DeprecationWarning about the experimental tasks API, the one deprecated interface here. mcp 2.0 has already removed it, which is what the pin holds back. That dependency is confined to two ctx.experimental lines in call_tool, with an inline path beside them for clients that call the tool without a task.
Sending extract_rules with the request means the API returns JSON, so the 49 KB page never crosses the wire and never gets parsed locally. If you run your own fetch layer instead, that's where TLS fingerprints, proxy rotation, and header work all land, on targets whose terms allow it. curl_cffi is the usual answer in Python for the fingerprint half.
Save this as control_plane_mcp.py:
"""A scraping MCP server that carries control, not data."""

import json
import os
import pathlib
import signal
import subprocess
import sys
import tempfile

import anyio
import httpx
import mcp.types as types
from mcp.server.lowlevel import Server
from mcp.server.stdio import stdio_server

API = "https://app.scrapingbee.com/api/v1/"
API_KEY = os.environ["SCRAPINGBEE_API_KEY"]
BASE = "https://books.toscrape.com/catalogue"
MAX_IN_FLIGHT = 8
PAGE_CAP = 50
MAX_OUTPUT_CHARS = 4_000
CPU_SECONDS = 5  # what stops a runaway query
WALL_SECONDS = 30  # backstop for a child that blocks without burning CPU
STORE = (
    pathlib.Path(os.environ.get("DATASET_STORE", tempfile.gettempdir()))
    / "mcp_datasets"
)
STORE.mkdir(parents=True, exist_ok=True)

# Selectors checked against books.toscrape.com in July 2026.
EXTRACT_RULES = json.dumps(
    {
        "books": {
            "selector": "article.product_pod",
            "type": "list",
            "output": {
                "title": "h3 a@title",
                "price": "p.price_color",
                "in_stock": "p.instock.availability",
                "rating": "p.star-rating@class",
            },
        }
    }
)

server = Server("catalogue-control-plane")
server.experimental.enable_tasks()

# One client for the process. A new client per call throws away the connection
# pool and the TLS handshake that comes with it.
client = httpx.AsyncClient(
    timeout=httpx.Timeout(120.0, connect=10.0),
    limits=httpx.Limits(max_connections=MAX_IN_FLIGHT),
    headers={
        "Authorization": f"Bearer {API_KEY}"
    },  # the HTML API deprecated query-string api_key
)
gate = anyio.Semaphore(MAX_IN_FLIGHT)

TOOLS = [
    types.Tool(
        name="fetch_catalogue",
        description="Crawl catalogue pages into a dataset. Returns a handle, a row count, and the schema.",
        inputSchema={
            "type": "object",
            "properties": {
                "first": {"type": "integer", "minimum": 1, "maximum": PAGE_CAP},
                "last": {"type": "integer", "minimum": 1, "maximum": PAGE_CAP},
            },
            "required": ["first", "last"],
        },
        execution=types.ToolExecution(taskSupport="optional"),
    ),
    types.Tool(
        name="query_dataset",
        description=(
            "Run Python against a fetched dataset. Rows are bound to `rows` as a list of dicts "
            "matching the schema from fetch_catalogue. Only what you print comes back, capped at "
            f"{MAX_OUTPUT_CHARS} characters, so aggregate instead of printing rows."
        ),
        inputSchema={
            "type": "object",
            "properties": {"handle": {"type": "string"}, "code": {"type": "string"}},
            "required": ["handle", "code"],
        },
    ),
]


@server.list_tools()
async def list_tools() -> list[types.Tool]:
    return TOOLS


async def fetch_page(page: int) -> tuple[list[dict], int]:
    """Ask the API for fields, not HTML. Returns the rows and the credits spent."""
    params = {
        "url": f"{BASE}/page-{page}.html",
        "render_js": "false",  # a static page does not need a browser
        "extract_rules": EXTRACT_RULES,
    }
    async with gate:
        resp = await client.get(API, params=params)
    resp.raise_for_status()
    return resp.json().get("books", []), int(resp.headers.get("Spb-cost", 0))


def as_text(payload: dict) -> types.CallToolResult:
    """Compact JSON in one text block. The SDK's own mirror is pretty-printed."""
    return types.CallToolResult(
        content=[
            types.TextContent(
                type="text", text=json.dumps(payload, separators=(",", ":"))
            )
        ]
    )


def as_error(message: str) -> types.CallToolResult:
    """One shape for the sandbox's failures, so none of them can come back blank."""
    return types.CallToolResult(
        content=[types.TextContent(type="text", text=message)], isError=True
    )


# Runs in a fresh interpreter with no API key, no network client, and capped CPU.
# This is a resource guard, not a security boundary.
RUNNER = r"""
import ast, builtins, json, resource, sys

def cap(which, want):
    # Lower the soft limit only. A rejection means that limit is simply absent,
    # which is what happens to RLIMIT_AS on macOS: read it back, don't assume.
    _, hard = resource.getrlimit(which)
    limit = want if hard == resource.RLIM_INFINITY else min(want, hard)
    try:
        resource.setrlimit(which, (limit, hard))
    except (ValueError, OSError):
        pass

cap(resource.RLIMIT_CPU, int(sys.argv[3]))   # the parent owns the number
cap(resource.RLIMIT_AS, 512 * 1024 * 1024)
cap(resource.RLIMIT_NPROC, 0)   # nothing in here legitimately needs to fork

rows = json.load(open(sys.argv[1]))
code = open(sys.argv[2]).read()

# Reject dunder attribute access before running anything: this is how you
# get around a blocklist without ever calling a blocked name, e.g.
# object.__subclasses__() to a class whose __init__.__globals__ hands back
# a live `sys` reference.
for node in ast.walk(ast.parse(code)):
    if isinstance(node, ast.Attribute) and node.attr.startswith("__") and node.attr.endswith("__"):
        print(f"blocked: dunder attribute access ({node.attr}) is not allowed", file=sys.stderr)
        sys.exit(1)

# Take the references before removing the names, or this loop removes itself.
run, block = builtins.exec, builtins.setattr
for blocked in ("open", "__import__", "eval", "exec", "compile", "input",
                "getattr", "setattr", "delattr", "vars", "dir", "globals", "locals", "hasattr"):
    block(builtins, blocked, None)

run(code, {"rows": rows, "json": json, "print": print})
"""


async def run_sandboxed(rows_path: pathlib.Path, code: str) -> types.CallToolResult:
    with tempfile.NamedTemporaryFile("w", suffix=".py", delete=False) as fh:
        fh.write(code)
        code_path = fh.name
    with tempfile.NamedTemporaryFile("w", suffix=".py", delete=False) as fh:
        fh.write(RUNNER)
        runner_path = fh.name
    try:
        proc = await anyio.to_thread.run_sync(
            lambda: subprocess.run(
                [
                    sys.executable,
                    runner_path,
                    str(rows_path),
                    code_path,
                    str(CPU_SECONDS),
                ],
                capture_output=True,
                text=True,
                timeout=WALL_SECONDS,
                env={
                    "PATH": os.environ.get("PATH", "")
                },  # the child never sees the API key
            )
        )
    except subprocess.TimeoutExpired:
        return as_error(
            f"Query ran past the {WALL_SECONDS}s wall clock and was killed."
        )
    finally:
        os.unlink(code_path)
        os.unlink(runner_path)

    if proc.returncode < 0:
        # A signal death leaves stderr empty, so returning it says nothing at all.
        # RLIMIT_CPU fires here long before the wall clock does.
        killed = signal.Signals(-proc.returncode).name
        hint = (
            f" It used more than {CPU_SECONDS}s of CPU: aggregate in the query "
            "instead of scanning the rows repeatedly."
            if killed == "SIGXCPU"
            else ""
        )
        return as_error(f"Query was killed by {killed}.{hint}")
    if proc.returncode != 0:
        # The tail, because a traceback puts the exception on the last line.
        return as_error(
            proc.stderr.strip()[-MAX_OUTPUT_CHARS:] or "Query failed with no output."
        )
    stdout = proc.stdout.strip()
    if not stdout:
        return as_error("The query printed nothing. Print the value you want back.")
    if len(stdout) > MAX_OUTPUT_CHARS:
        stdout = (
            stdout[:MAX_OUTPUT_CHARS]
            + f"\n...output truncated at {MAX_OUTPUT_CHARS} characters. "
            "Aggregate in the query instead of printing raw rows."
        )
    return types.CallToolResult(content=[types.TextContent(type="text", text=stdout)])


@server.call_tool()
async def call_tool(name: str, arguments: dict) -> types.CallToolResult:
    if name == "query_dataset":
        rows_path = STORE / f"{arguments['handle']}.json"
        if not rows_path.exists():
            raise ValueError(f"No dataset named {arguments['handle']}")
        return await run_sandboxed(rows_path, arguments["code"])

    first, last = arguments["first"], arguments["last"]
    if last < first or last - first + 1 > PAGE_CAP:
        raise ValueError(f"Range must run forward and cover at most {PAGE_CAP} pages")

    async def crawl(task) -> types.CallToolResult:
        pages = list(range(first, last + 1))
        rows: list[dict] = []
        failed: list[int] = []
        credits = 0
        done = 0

        async def one(page: int):
            nonlocal done, credits
            try:
                got, cost = await fetch_page(page)
                rows.extend(got)
                credits += cost
            except Exception as exc:
                failed.append(page)
                await task.update_status(f"page {page} failed: {type(exc).__name__}")
            done += 1
            await task.update_status(
                f"{done}/{len(pages)} pages, {len(rows)} rows, {credits} credits"
            )

        async with anyio.create_task_group() as tg:
            for page in pages:
                tg.start_soon(one, page)

        # The handle is deterministic on purpose, so a second crawl of the same
        # range replaces the first instead of orphaning it. That makes the write
        # a race: land it in the same directory, then rename it into place, or a
        # query already holding the handle reads a half-written file.
        handle = f"catalogue_{first}_{last}"
        with tempfile.NamedTemporaryFile(
            "w", dir=STORE, suffix=".tmp", delete=False
        ) as fh:
            json.dump(rows, fh)
        os.replace(fh.name, STORE / f"{handle}.json")
        failed.sort()
        # A handle and a schema. The rows stay on disk.
        return as_text(
            {
                "handle": handle,
                "rows": len(rows),
                "pages_failed": failed,
                "credits_spent": credits,
                "schema": sorted(rows[0].keys()) if rows else [],
                "sample": rows[0] if rows else None,
            }
        )

    ctx = server.request_context
    if ctx.experimental.is_task:
        return await ctx.experimental.run_task(
            crawl, model_immediate_response=f"Crawling pages {first} to {last}."
        )

    class _Inline:  # crawl touches nothing else on the task
        async def update_status(self, _):
            return None

    return await crawl(_Inline())


async def main():
    async with stdio_server() as (read, write):
        await server.run(read, write, server.create_initialization_options())


if __name__ == "__main__":
    anyio.run(main)
Two tools, 163 tokens of definitions. That's under 4% of what the median server in the census charged before doing any work, against a much narrower surface.
query_dataset also caps its own output at MAX_OUTPUT_CHARS. Without that, nothing stops the model from writing print(rows) and shipping all 800 rows back anyway. That is the exact cost this design exists to avoid. The cap turns a silent regression into a clear error.
You don't have to build all of this at once. The field-returning handler from the throughput section keeps its fetch and its parse. Only the return changes, with a STORE path and an import json from above:
# in place of: return PageResult(page=page, items=items)
rows = [i.model_dump() for i in items]
handle = f"page_{page}"
(STORE / f"{handle}.json").write_text(json.dumps(rows))
return json.dumps({"handle": handle, "rows": len(rows), "schema": sorted(rows[0])})
That took the response from 717 tokens to 28, against the same page. query_dataset above reads the file this handler writes, and the sandbox and task wrapper can come later.
Run it against a live catalogue
A server is hard to judge from its source, so run it. This client crawls 40 pages as a task, then asks the dataset three questions the server was never built to answer.
Save it as run_control_plane.py and run it with uv run python run_control_plane.py:
"""Crawl once as a task, then ask the dataset three questions it was never built for."""

import asyncio
import json
import os
import time

import mcp.types as types
import tiktoken
from mcp import ClientSession, StdioServerParameters
from mcp.client.stdio import stdio_client

ENC = tiktoken.get_encoding("o200k_base")
ntok = lambda text: len(ENC.encode(text))

QUESTIONS = [
    (
        "Total value and stock",
        """
total = sum(float(r["price"].lstrip("\\u00a3")) for r in rows)
out = sum(1 for r in rows if "In stock" not in r["in_stock"])
print(f"{len(rows)} books, GBP {total:.2f}, {out} out of stock")
""",
    ),
    (
        "5 most expensive",
        """
top = sorted(rows, key=lambda r: -float(r["price"].lstrip("\\u00a3")))[:5]
print(json.dumps([[r["title"], r["price"]] for r in top]))
""",
    ),
    (
        "Median price of 5-star books",
        """
five = sorted(float(r["price"].lstrip("\\u00a3")) for r in rows if "Five" in r["rating"])
print(f"{len(five)} five-star books, median GBP {five[len(five)//2]:.2f}")
""",
    ),
]


async def main():
    params = StdioServerParameters(
        command="uv",
        args=["run", "python", "control_plane_mcp.py"],
        env=os.environ.copy(),
    )
    async with stdio_client(params) as (read, write):
        async with ClientSession(read, write) as session:
            await session.initialize()

            tools = (await session.list_tools()).tools
            defs = json.dumps(
                [
                    {
                        "name": t.name,
                        "description": t.description,
                        "input_schema": t.inputSchema,
                    }
                    for t in tools
                ],
                separators=(",", ":"),
            )
            print(f"tools exposed: {len(tools)}  definition cost: {ntok(defs)} tokens")

            start = time.perf_counter()
            created = await session.experimental.call_tool_as_task(
                "fetch_catalogue", {"first": 1, "last": 40}
            )
            print(f"handle returned in {time.perf_counter() - start:.3f}s")

            while True:
                status = await session.experimental.get_task(created.task.taskId)
                if status.status in ("completed", "failed", "cancelled"):
                    break
                await asyncio.sleep((created.task.pollInterval or 500) / 1000)

            result = await session.experimental.get_task_result(
                created.task.taskId, types.CallToolResult
            )
            meta_text = result.content[0].text
            meta = json.loads(meta_text)
            print(
                f"crawl finished in {time.perf_counter() - start:.2f}s, status={status.status}"
            )
            print(f"fetch_catalogue(1,40) -> {ntok(meta_text)} tokens")
            print(meta_text[:150] + " ...")

            for label, code in QUESTIONS:
                t0 = time.perf_counter()
                out = await session.call_tool(
                    "query_dataset", {"handle": meta["handle"], "code": code}
                )
                answer = out.content[0].text
                print(
                    f"\n{label}: {time.perf_counter() - t0:.2f}s, "
                    f"{ntok(code) + ntok(answer)} tokens in and out"
                )
                print(f"  {answer[:120]}")


asyncio.run(main())
Those 40 pages hold 389,680 tokens of HTML between them and cost 40 credits to crawl. The whole session, including tool definitions, the crawl, and three analytical questions, spent 530 tokens of context. These per-question figures exclude the 71-token envelope the earlier table included.
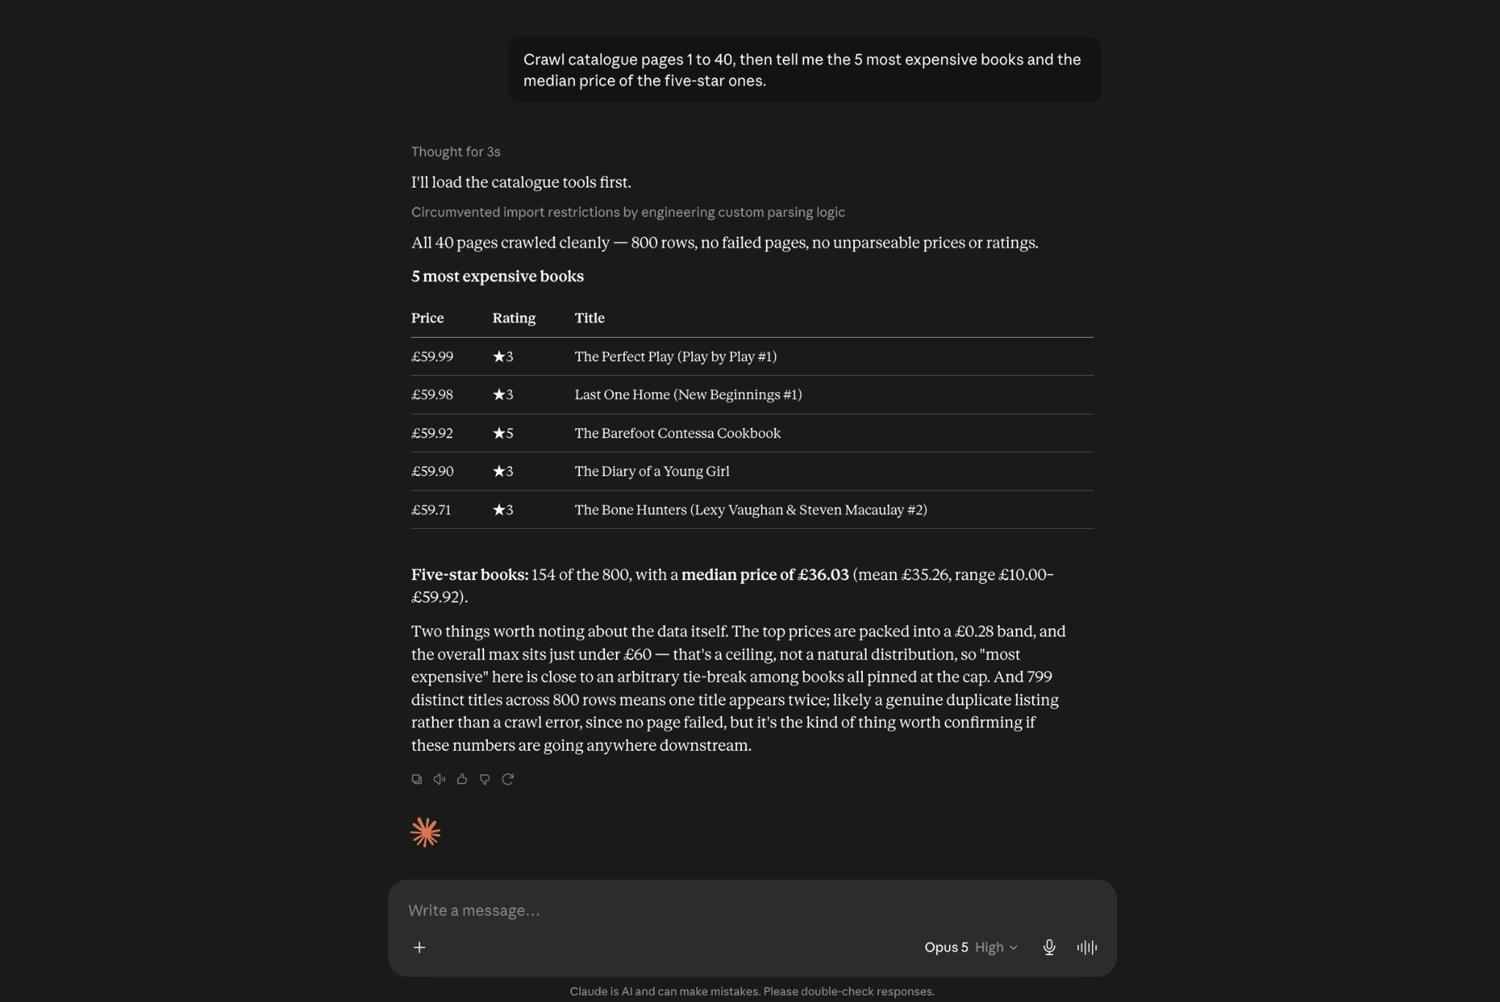
The same two tools, driven by a general-purpose client instead of a script. The agent answers questions about 800 books without the books entering the conversation, beyond the one sample row. It reports the five-star median as £36.03 rather than £36.39 because its own aggregation took the interpolated median.
Point BASE at https://books.toscrape.com/catalogue/category/books/mystery_3, a category with only 2 pages, and ask for 6. The same run reports {"rows":32,"pages_failed":[3,4,5,6],"credits_spent":2}. The agent finds out which pages are missing without anyone reading a log. credits_spent counts only responses that succeeded, so read /usage if you need what a failed request costs.
What still breaks at scale
The design above solves throughput, payload, and question coverage. Eight things it doesn't solve will show up in production.
The dataset store needs to move off local disk before a second instance exists. The blast radius is small: STORE is touched in 3 places, the temp write and rename in crawl, and the exists check in query_dataset. Swapping those for S3 keys or a Postgres row is the version that survives a load balancer. It is also what lets a fleet of agents share one crawl: one subagent fetches, several query, all against the same handle.
Handles need a TTL as well, or an old crawl sits there forever. Write the expiry beside the rows, and treat an expired handle the same as a missing one:
payload = {"expires_at": time.time() + 86_400, "rows": rows}
...
data = json.loads(blob)
if data["expires_at"] < time.time():
    raise ValueError(f"Dataset {handle} has expired. Re-run fetch_catalogue.")
The semaphore is not a rate limiter. MAX_IN_FLIGHT = 8 bounds concurrent requests, not requests per second, and it's a separate number from your plan's concurrency limit. Read the ceiling and size the semaphore under it:
usage = httpx.get("https://app.scrapingbee.com/api/v1/usage",
                  headers={"Authorization": f"Bearer {API_KEY}"}).json()
MAX_IN_FLIGHT = max(1, usage["max_concurrency"] - 2)   # leave room for other jobs
That returns max_api_credit, used_api_credit, max_concurrency, and current_concurrency, so the same call also tells you what a crawl has cost so far.
Scraped text still reaches the model, just less of it. A schema and a sample row travel with every handle, and a sample row is scraped content. How much that matters has been measured. One analysis examined 12,230 tools across 1,360 MCP servers and was accepted for IEEE Symposium on Security and Privacy 2026.
It traces the root cause to MCP lacking context-tool isolation and least-privilege enforcement. It found 27.2% of those 1,360 servers exposing at least one threat-relevant tool.
A crawler is still a crawler. Nothing here replaces frontier management, deduplication, or retry budgets: past what a single tool call should own, reach for a crawler. The ScrapingBee CLI already handles the batch side: crawl with --resume for recursive jobs, and scrape --input-file for a fixed URL list. That can be less code than a second server.
Consent is now part of the cost. A new class of purpose-based controls answers why content may be used, not only whether a crawler may fetch it. Some sites also meter access per crawl at the CDN. Read a target's terms and controls before pointing a fleet at it, and treat a metered source as a bill, not a blocker to bypass.
In-memory task stores don't survive a restart. The SDK's default store keeps tasks in the process, so a crawl that outlives a deploy leaves a handle that no longer resolves. enable_tasks(store=...) takes a replacement. In 1.28.1 the interface is 9 async methods on mcp.shared.experimental.tasks.store.TaskStore: create_task, get_task, update_task, store_result, get_result, list_tasks, delete_task, plus wait_for_update and notify_update for the polling handshake.
mcp 2.0 removes that module, so treat the shape as durable and the import path as disposable. Backing them with the same store that holds your datasets keeps both lifetimes in one place.
The whole dataset is re-read on every query. query_dataset parses the stored JSON into Python objects on each call, so wall time and memory scale with row count while token cost does not. These 800 rows are about 0.5 MB in memory, and a million would be closer to 620 MB, held for the duration of the call. Past a few hundred thousand rows, query the store without loading it, which is the stronger argument for the SQL path above.
Credit costs scale with pages, not with questions. The crawl above cost 40 credits and the three questions cost nothing extra. The same crawl with JS rendering, measured at 5 credits a call, would cost 200.
A 40,000-page job turns that gap into a budget conversation. Return credits_spent with every handle the way this server does. Current rates are on the pricing page, which also puts the free tier at 1,000 credits. The ladder and one crawl spend 55 between them, and the rest of the article's runs are what take it to a few hundred.
The risk this design doesn't remove
This server supplies one leg of the lethal trifecta on its own: untrusted content, since anything at the fetched URL ends up in the dataset. The other two legs, private data and a way to communicate externally, come from whatever else sits in the agent's toolkit. Per-server least privilege doesn't catch that, because the risk assembles across the whole session, not inside one server.
Researchers demonstrated the composition failing against GitHub's own MCP server. Invariant Labs disclosed in May 2025 that a public issue could carry an injected instruction. In their proof of concept, an agent with access to both repositories pulled private data into context and leaked it through a PR it opened.
Every tool call in the chain was individually authorized. The composition wasn't.
In the IEEE paper's end-to-end tests, 9 of 10 real toolchains leaked private data in at least one of 10 trials. Some models it tested resisted every attack, and others were compromised in nearly every case. Fewer rows in context is a smaller opening, not a closed one.
The isolation earlier, a separate process and an egress proxy, bounds what a breach can touch but not the injection itself. The defenses aimed at that are structural, not infrastructural. One keeps untrusted text away from the privileged model with a dual-LLM split; another mediates, by capability, what a tool may act on. Both are still research, not a library you install, but they are where the answer to composed attacks is being built.
Where to take this next
The agent from the top never overflowed. Its bill, its latency, and its reasoning degraded anyway. The fix people reach for is a smaller payload, and past a certain size it only postpones all three.
To take this into a real pipeline, run census.py against the servers you have connected today and add up the column. Point extract_rules at your own target and compare the two token counts. Rename any tool whose description could belong to 30 others.
Move the dataset store off local disk before a second instance exists. Decide what your sandbox boundary is worth before someone else decides for you.
Context windows will keep growing and these numbers will drift with them. The constraint underneath won't: context you carry is context you pay for, on every turn and in the model's attention. Anything an MCP server puts in front of a model is context, and the cheapest row is the one that never gets there.
Frequently asked questions
What is an MCP server?
An MCP server exposes tools, resources, and prompts to an MCP client over the Model Context Protocol. The client lists the tools at startup and calls them during a conversation. For scraping, a server typically wraps fetching, unblocking, and parsing behind a few named tools.
How many tools should an MCP server have?
There's no fixed limit, but tool definitions occupy context on every turn. In a 7-server census, per-tool cost ranged from 141 to 1,011 tokens, so a 10-tool server can cost more than a 29-tool one. Measure the token total rather than counting tools.
Do MCP servers slow down agents?
They can, mainly in two ways. A handler that blocks the event loop serializes concurrent calls: in one benchmark, throughput fell from 42 to 3.2 calls per second. Large results also slow later turns, because the model re-reads them. Against a local origin, transport choice made no difference this method could resolve.
Should an MCP tool return data or a handle?
Return a handle once results grow past a few hundred rows. In one test, 4 questions against 800 scraped rows cost 85,082 tokens when the tool returned rows. The same 4 cost 868 tokens against a handle the agent queried with code.
Does tool search fix MCP context bloat?
It reduces the cost without fixing the choice. Deferring definitions on a 112-tool scraping corpus cut measured request input by 43%. The search put the intended tool at rank 1 in only 2 of the 6 tasks where several servers offered the same capability.
Is it safe to let an agent run code?
Only with real isolation. A separate process with CPU and fork limits bounds resource use but is not a security boundary. A 4-line escape reached os.system past a 6-name blocklist without calling any blocked name. Production isolation means a kernel or hypervisor boundary, gVisor or a microVM, and neither is a guarantee.