Whether you are building a microservices architecture or integrating third-party payment gateways, API monitoring is the heartbeat of your system. I've spent years building scrapers and backend services, and I've learned the hard way that "it works on my machine" doesn't mean it stays working at 3:00 AM.
Modern applications depend on robust API monitoring because even a few seconds of downtime can cascade into a total system failure. When you're managing dozens of endpoints, you need more than just a ping; you need a way to ensure API reliability and catch performance bottlenecks before your users do. In this guide, I'll compare the best API monitoring tools available in 2026 to help you make an informed decision for your stack.
Quick Answer: What Is API Monitoring?
At its core, API monitoring is the practice of checking your API endpoints at regular intervals to ensure they are available, responding quickly, and returning the correct data. It's the difference between knowing your server is "on" and knowing your /checkout endpoint actually processes a credit card in under 200ms.
Effective API monitoring involves several key layers:
- Uptime checks: Simple "is it alive?" heartbeats.
- API performance monitoring: Tracking latency and response times over time.
- Validation and Alerts: Ensuring the JSON schema is correct and notifying the team via Slack or PagerDuty when it isn't.
It is important to distinguish this from API analytics. While analytics focuses on who is using your API and for what business purpose, monitoring is about the health and technical execution of those calls.
Shortlist - Best API Monitoring Tools in 2026
Before we dive into the weeds, here is a high-level look at the various API monitoring tools I've evaluated. Choosing an API monitoring solution depends heavily on whether you need deep infrastructure metrics or high-level user behavior insights.
| Tool | Best For | Pros | Cons | Pricing (USD/month) |
|---|---|---|---|---|
| Moesif | SaaS companies & billing integration | Deep user behavior tracking; excellent debugging; handles high volume. | Interface can be overwhelming; complex pricing structure. | Free tier available; Pro starts at $150 |
| Uptrace | Microservices & OpenTelemetry fans | SQL-like querying; easy to self-host; great span visualization. | Requires knowledge of OpenTelemetry instrumentation. | Free (OSS) or Cloud starts at $40 |
| Datadog | Enterprise-scale infrastructure | Massive integration library; AI-powered alerts; full-stack visibility. | Notorious for "bill shock" as it scales; complex setup. | Starts at $15 per host |
| Treblle | Fast-moving startups | "Plug-and-play" setup; auto-documentation; security scoring. | Less granular infrastructure metrics than competitors. | Free tier available; Paid starts at $99 |
| Prometheus | Kubernetes & Cloud-native DIY | Extremely scalable; no licensing fees; massive community. | Steep learning curve; manual storage/dashboard management. | Free (Self-hosted) |
Best API Monitoring Tools in 2026 (Detailed Comparison)
When evaluating API performance monitoring tools, I look at more than just a pretty UI. I focus on tracking API performance under load, the granularity of alerting, and how easily it integrates into a CI/CD pipeline. A robust API monitoring setup should scale as your traffic grows without requiring a full-time engineer to maintain it.
1. Moesif
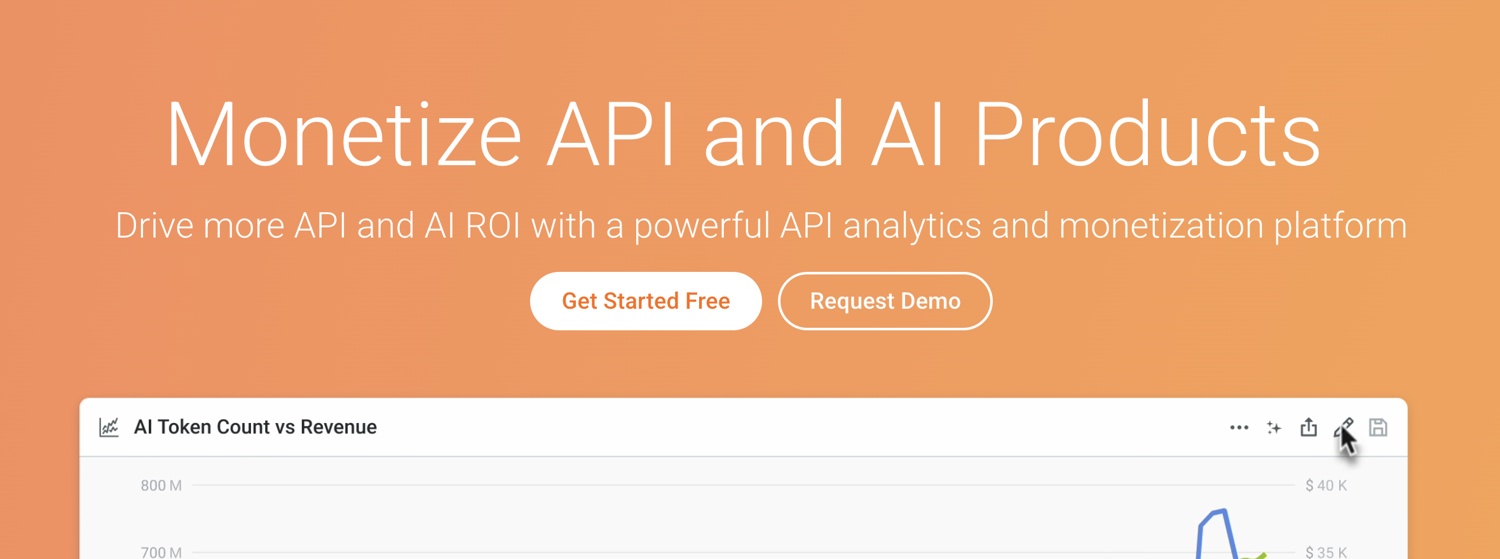
Moesif is an API analytics powerhouse that happens to have a great monitoring crossover. I tested Moesif for 14 days on a high-traffic fintech project, and its ability to link API failures to specific user accounts was a game-changer for our API monitoring strategy.
- Description: A developer-centric platform that tracks how customers use your APIs.
- Best For: SaaS companies & billing integration
- Pros: Excellent debugging tools; handles high volume; deep user behavior tracking.
- Cons: The interface can be overwhelming, and the pricing is complex.
- Pricing: Generous free tier; Pro plans start around $150/month.
2. Uptrace
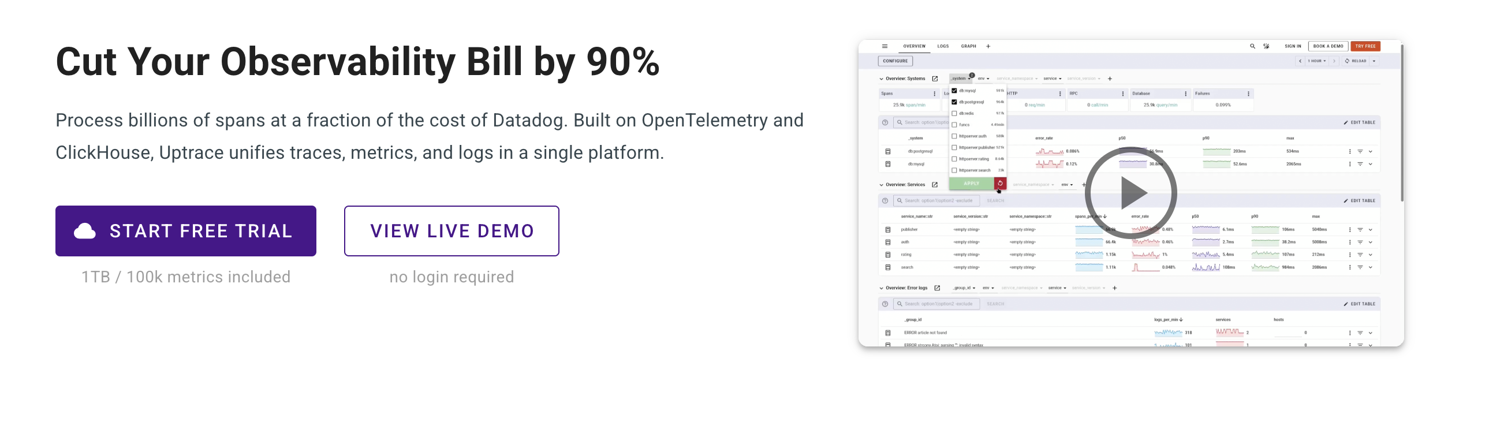
If you're a fan of OpenTelemetry, Uptrace is a fantastic API performance monitoring choice. It focuses on distributed tracing, allowing you to see exactly where a request slowed down—was it the database, a third-party service, or your code?
- Description: An open-source-friendly tool for tracking API performance through distributed tracing.
- Best For: Teams using microservices who want an OpenTelemetry-native experience.
- Pros: SQL-like querying; easy to self-host; great visualization of spans.
- Cons: Requires knowledge of OpenTelemetry instrumentation.
- Pricing: Cloud version starts at $40/month; open-source version is free.
3. Datadog
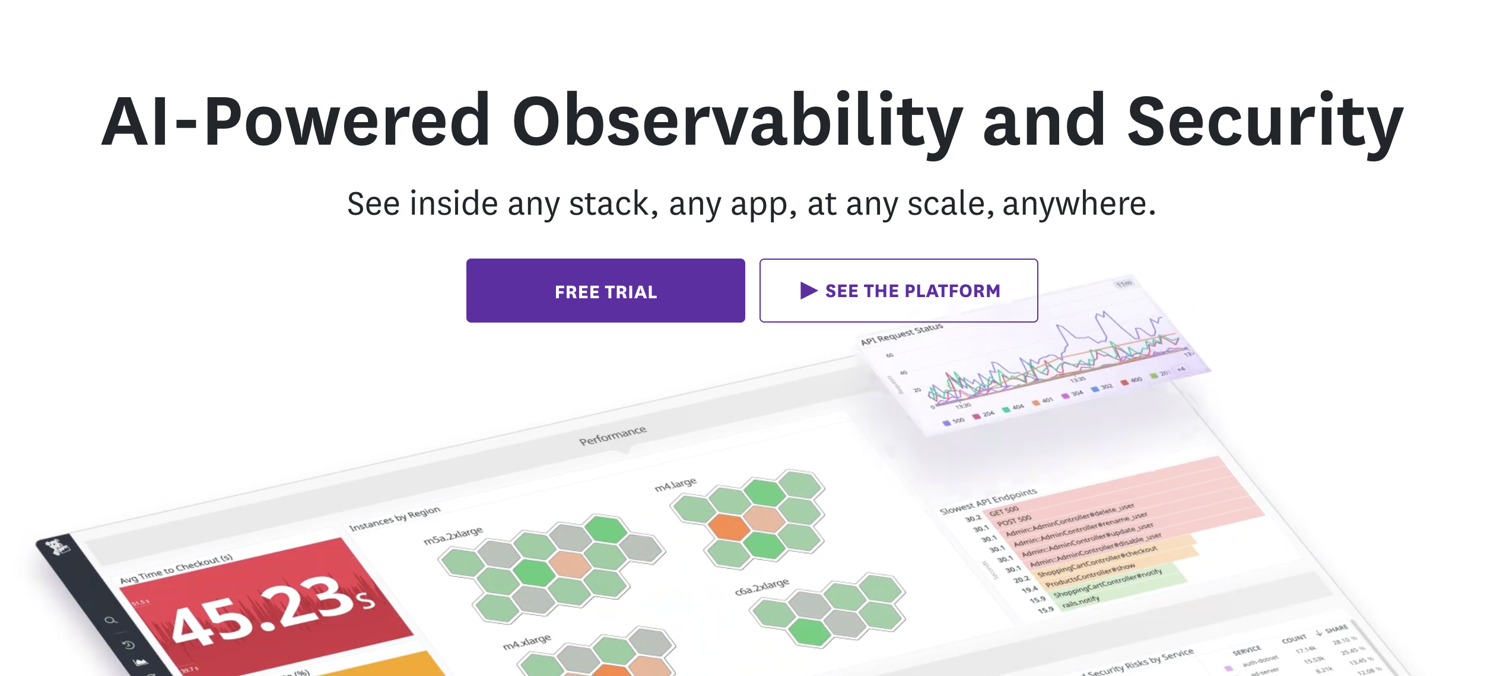
Datadog is the "gold standard" for enterprise-grade API performance monitoring tools. It offers a comprehensive API monitoring strategy by combining logs, metrics, and traces into a single pane of glass with AI-powered alerts that filter out the noise.
- Description: A full-stack observability platform for monitoring cloud-scale applications.
- Best For: Large engineering teams managing complex, multi-cloud infrastructures.
- Pros: Massive integration library; industry-leading AI alerts; SLA monitoring.
- Cons: Pricing is notorious for scaling quickly and becoming "bill shock".
- Pricing: Per-product pricing; typically starts at $15/host/month.
4. Treblle
Treblle is an API monitoring solution built for speed. It provides real-time monitoring and security audits, which are essential for maintaining API reliability without manual configuration.
- Description: An all-in-one platform for API lifecycle management and monitoring.
- Best For: Fast-moving startups and developers who want "plug-and-play" monitoring.
- Pros: Auto-generated documentation; security scoring; very easy setup.
- Cons: Less granular infrastructure metrics compared to Datadog.
- Pricing: Free for small projects; paid tiers start at $99/month.
5. Prometheus
For the DIY crowd, Prometheus is the king of monitoring API endpoints in Kubernetes environments. It uses a pull-based metrics scraping model that provides robust API monitoring, but it requires significant DevOps expertise to manage.
- Description: An open-source monitoring and alerting toolkit.
- Best For: Organizations heavily invested in Kubernetes and cloud-native architectures.
- Pros: Extremely scalable; massive community support; no licensing fees.
- Cons: Steep learning curve; you have to manage your own storage and dashboards (Grafana).
- Pricing: Free (Self-hosted).
Why Tracking API Performance Is Crucial
I once saw a major e-commerce site lose thousands in revenue because its "Add to Cart" API latency jumped from 200ms to 5 seconds. The site wasn't "down," but for the users, it was broken. Tracking API performance is about protecting your bottom line and user trust.
High latency leads to abandonment, and poor API reliability can lead to failed transactions that are a nightmare to reconcile. According to G2 and industry benchmarks, even a one-second delay in page response can result in a 7% reduction in conversions. Maintaining API performance isn't just a technical goal; it's a business requirement.
Key API Metrics to Monitor
To build an effective API monitoring plan, you need to know what to measure. A comprehensive API monitoring strategy breaks down into four main pillars:
Performance Metrics
Focus on how fast things are moving.
- Latency: Time taken for a single request.
- Throughput: Number of requests your API handles per second. Keyword: API performance monitoring.
Reliability Metrics
Focus on whether things are actually working.
- Error Rate: Percentage of 4xx and 5xx responses.
- Uptime: The percentage of time the API is reachable. Keyword: API reliability.
Resource Utilization
Focus on the health of the underlying hardware.
- CPU/Memory: Ensuring your monitoring API tasks aren't choking the server.
- Infrastructure Load: Scaling limits of your load balancer. Keyword: monitoring API.
Business Impact Metrics
Focus on the "why."
- Failed Transactions: How many checkouts failed due to API errors?
- Usage Trends: Is the API analytics showing a drop in traffic during peak hours? Keyword: API analytics.
How to Choose the Right API Monitoring Tool
Selecting an API monitoring tool shouldn't be a shot in the dark. When I help teams find the right API monitoring tool, I use this checklist:
- Team Size: Do you have a dedicated DevOps team for Prometheus, or do you need the ease of Treblle?
- Architecture: Are you cloud-native, or are you managing legacy on-premise servers?
- Compliance: Does the API monitoring solution meet GDPR or SOC 2 standards for data handling?
- Budget: Will the tool's cost scale linearly with your traffic, or is there a cap?
API Logging and Monitoring Best Practices
A comprehensive API monitoring strategy requires more than just tools; it requires a process.
- Define Alert Thresholds: Don't wake up for a single 500 error, but do wake up if the error rate hits 1%.
- Use Incident Playbooks: When an alert fires, the developer should know exactly what steps to take.
- Implement Redundancy: Don't let your API monitoring strategy have a single point of failure.
Building Your Own Custom API Monitoring Scripts
Sometimes, the best API monitoring tools are the ones you write yourself. For simple uptime checks, a Python script running as a cron job or a serverless function can effectively monitor API performance at zero cost.
However, be careful. While custom scripts offer maximum flexibility, the maintenance overhead grows exponentially. I've seen teams spend more time fixing their API performance-monitoring scripts than fixing their actual product. Use custom scripts for specific, niche checks, but rely on professional tools for core infrastructure.
Use ScrapingBee to Build Your API Monitoring Tool
It is important to clarify that ScrapingBee is not a dedicated API monitoring solution. However, we are a key piece of infrastructure that can help you monitor API performance in ways traditional tools can't.
Our API allows you to fetch data from endpoints that might be protected by complex rate limits or geographical restrictions. If you need to verify API reliability by checking how your data appears from a user's perspective in Tokyo versus London, our solution can handle the proxy management and headless browsing for you. It's a powerful way to add "real-world" validation to your monitoring workflow.
Ready to Strengthen Your API Monitoring Stack?
Building a robust API monitoring environment is an iterative process. By combining industry-leading tools like Datadog or Moesif with reliable infrastructure, you can ensure high API reliability and peak API performance for your users.
If you're building a system that relies on fetching and validating web data at scale, we're here to help. Click here to get free credits and see how our infrastructure can complement your monitoring stack.
API Monitoring Tool FAQs
What is an API monitoring tool?
It is a software service that continuously checks API endpoints for availability, response time, and data correctness to ensure a smooth user experience.
What is the best tool for monitoring API calls?
The "best API monitoring tools" depend on your needs: Datadog for enterprise observability, Moesif for analytics, or Treblle for ease of use.
How do enterprises approach API monitoring at scale?
Enterprises typically use a comprehensive API monitoring strategy that includes distributed tracing, AI-driven alerting, and multi-region uptime checks.
What API metrics should I monitor first?
Start with the "Golden Signals": Latency, Traffic, Errors, and Saturation. These provide the quickest insight into API performance monitoring health.
Are there API monitoring tools with AI-based alerts?
Yes, tools like Datadog and Moesif use machine learning to identify "anomalies" rather than just static thresholds, reducing false positives.
What is the difference between API monitoring and API analytics?
Monitoring focuses on the technical health and uptime of the API, while API analytics focuses on business metrics, user behavior, and how the API is being consumed.

Karolis is Head of Growth at ScrapingBee. Previously built and scaled technology products in data and e-commerce verticals.